What is Apache Eagle?
Apache Eagle is an open-source solution which is used to instantly analyze and identify the security issues of several Big Data platforms such as Hadoop, NoSQL, etc. The analytical solution was developed at eBay (an e-commerce company), but soon after realizing that it may be helpful to the whole community, ebay donated the project to Apache Incubator in October 2015, since then Eagle has gained so much popularity.

Why named so?
An eagle bird is known for its attentiveness as well as a focused vision towards its prey. Its eyes very keenly observe the surrounding area and keep its eye focused towards its prey.
Same is the Apache Eagle that analyzes, monitor, and identifies the performances issues of Big Data platforms.
Apache Eagle analyzes the following:
- Yarn Applications(Yet Another Resource Negotiator which is used to split the functionalities of resource management as well as job schedulers)
- Data Activities, i.e., unwanted change in data
- JMX metrics (Java Management Extensions which is a standard way to instrument code in the JRE world)
- Daemon logs (a program that runs in the background) etc.
Therefore, Eagle analyzes and monitors background as well as foreground tasks by keeping an eye over each activity.
Steps involved in Analytics and Monitoring Flow
Now, the question is how Eagle analyzes and monitors different activities?
Apache Eagle performs three steps for analyzing and monitoring big data models:
- Data Integration: Data integrity means to maintain the consistency and accuracy of data. Raw data is either transformed or normalized during integration, and the output is streamed to the below discussed following steps. Data Integration is a streaming process application like Spark Streaming Application and other streaming process applications which may also use pull and push methods to stream data into Apache Eagle depending on the type of data source. For example, HDFS (Hadoop Distributed File System) audit log can be pushed by log stash whereas Hive query log can be pulled by Hive (Data Warehouse Software Project) Integration Application.
- Alerting Engines: These are highly scalable rule execution engine embedded into Data Integration application. Here, the user can create or update all related policies.
- Insights: It is used to correlate alerts with raw data so that the user can find out the rootcause. For example, if any malicious data was analyzed and identified by Eagle; therefore, it becomes easy for the user to identify what was the root cause.
Why Apache Eagle?/ Apache Eagle features
Because of the following features, one should choose Apache Eagle:
- Highly Extensible: Apache Eagle allows developers to develop their own monitoring applications and deploy to Eagle's framework in just a few clicks.
- Scalability: Apache Eagle operates on big data technologies such as Hadoop, Spark because the number of operational logs and user activities generated is huge. It also applies a scalable core to get adaptive according to different through puts of the data stream as well as several monitored applications.
- Real Time: Time is precious for all. Thus keeping in mind, the analytical solutions generate state-of-the-art (immediate alerts without wasting much time) alert engine to identify performances issues and security breaches. Storm and Spark Streaming based computing engine allows to apply the policy to the data and generate immediate alerts.
- Dynamic: Users are allowed to enable or disable a monitoring application and can change their alerting policies dynamically without any effect to underlying runtime.
- Metadata Driven: Eagle has designed its metadata in such a way that what kind of policies are to be evaluated for what type of data source under which physical boxes.
- Ease-of-Use: User can easily enable monitoring for service in just a few minutes by selecting the appropriate monitoring application and configuring the parameters required for the service.
Use Cases
Technically, a Use Case is either a diagrammatic representation or list of actions needed for the interaction of the user with the system. Apache Eagle is an open source solution for monitoring and identifying malicious and unwanted data activity for Hadoop and other Big Data platforms. Eagle follows some actions through which it can make a better understanding between the user activities and its service.
Apache Eagle has the following Use Cases:
- Data Activity Monitoring: The way user explores the data provided by different Big Data platforms is Data Activity. Therefore, analyzing the data activity and alerting for insecure and unwanted actions by generating immediate alarms are the basic needs for keeping the data secure. As we know, data activities increase every millisecond by different users; therefore, it is not easy to understand every data activity. Apache Eagle has made the work easy by integrating with Hadoop like Big data platforms. Using Eagle, user can easily browse data hierarchy, mark out the sensitive data, and finally create the comprehensive policies to make alert for insecure data access.
- Job Performance Analytics: It is not easy for Big Data platforms like Hadoop to analyze job performances and to provide suggestions. Therefore, Eagle analyzes job performances with two complimenting approaches, and they are:
- Firstly, Apache Eagle periodically takes snapshots for all running jobs with YARNAPI.
- Secondly, as soon the job is completed, it reads job lifecycle continuously.
Thus, with the help of the above two approaches, Eagle can analyze:
- Single job’s trend
- Data skew problem (i.e., to identify if the data distribution is uneven or asymmetric)
- Failures reason
- Eagle can also analyze the whole Hadoop Cluster's performance by taking all jobs in an account
- Node Anomaly Detection: Running Map or Reduce job is famous for analyzing data in the Hadoop system, which provides the practical benefit of node anomaly detection. Big Data platforms may involve thousands of nodes for supporting multi-tenant jobs, and one poor node may not crash whole clusters but affects specific jobs, causes a lot of rescheduling, job delay, etc. Thus, Eagle developed an intelligent and out of the box algorithm to compare the task failure ratio for each node and taking action against the node that behaves differently from other nodes. If one node continues to fail running task, it may have potential issues like sometimes its disk is full or fails, etc.
- Cluster Performance Analytics: It is not easy to understand why the cluster performs poorly; there may be certain reasons applicable. Apache Eagle in real-time calculates the use of resource per minute out of the individual jobs like CPU, memory, etc. and also collects namenode JMX metrics. Hence, it becomes easy for the administrator to find out the root cause for cluster slowness.
- Cluster Resource Usage Trend: Resource allocation is managed by YARN through the queue in a large Hadoop cluster, and overall use of the resource is reflected by queue usage. Eagle in real-time collects queue statistics and provide insights into it.
Eagle Architecture
The following architecture shows how Eagle looks like and how it works.
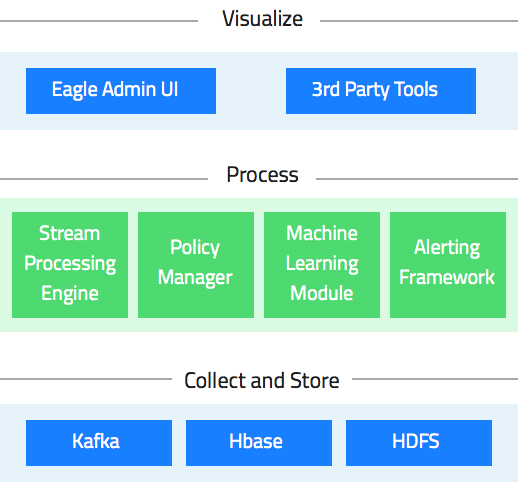
So, below are the systematic steps taken to describe the architecture of Apache Eagle.
- Data Collection: Apache Eagle provides a programming API to integrate any data source with Eagle policies that we have already seen in data integration. Therefore, through its programming API, Eagle integrates as well as collects data.
- Data Processing API:
2.1Steam Processing API: Eagle streaming API's permit developers to integrate business logic with the eagle policy engine easily. Internally, the framework compiles the business logic execution DAG into program primitives of their underlying stream infrastructure such as Apache Storm (an open source real-time distributed systems to process the data streams).
Here is the code for events and alert processing:
StormExecutionEnvironment env =

ExecutionEnvironmentFactory.getStorm(config);//Storm

StreamProducer producer=env.newSource(new

KafkaSourcedSpoutProvider().getSpout(config)).renameOutputFields(1)//declare Kafka source

.flatMap(new AuditLogTransformer()) //transform event

.groupBy(Arrays.asList(0)) //group by 1st field

.flatMap(new UserProfileAggregatorExecutor());

//aggregate one hour data by user

.alertWithConsumer(“userActivity”,”userProfileExecutor”) //

ML policy evaluate

Env.execute(); // execute stream processing and alert
2.2 Alerting Framework: It includes a stream metadata API that allows developers to declare event schema including what attributes constitute an event etc.
Eagle's extensible interface allows to plug in different policy engines
:
public  interface PolicyEvaluatorServiceProvider{

public String getPolicyType();//literal string to identify one type of policy

public Class getPolicyEvaluator();//get policy evaluator implementation

public List getBindingModules();//policy text with json format to object mapping

public interface PolicyEvaluator{

public void evaluate(ValuesArray input) throws Exception;// evaluate input event

public void onPolicyUpdate(AlertDefinitionAPIEntity new AlertDef);//policy update

public void onPolicyDelete();//invoked when policy is deleted
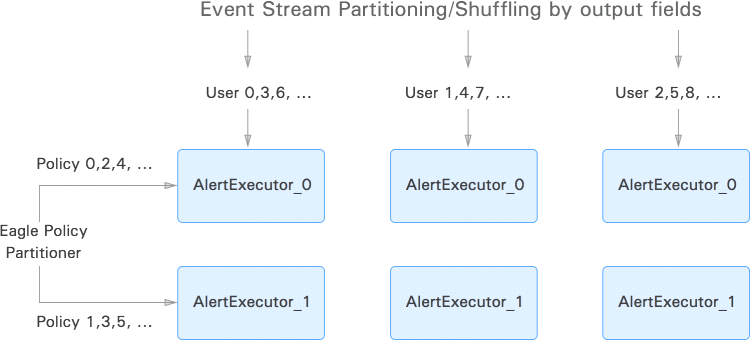
Policy Partitioner interface allows policies to be executed on different physical nodes parallelly. User can also define their own policy partitioner class that enables event and policy evaluation in a free distributive manner.
- Machine Learning Module: Eagle keeps an eye of what type of activities users do and detects anomalies. When the user generates his profile through the system and is modeled by Machine Learning Algorithms, it matches if the user activity pattern differs with the pattern history.Presently, Eagle uses two machine learning algorithms for anomaly detection.
- Density Estimation: Evaluating a probability density function from the observed training dataset sample by normalizing the dataset because normalization allows a dataset to be on the same scale.
How to calculate probability density estimation?
To do so
, Gaussian distribution function is used for computation under which during the online detection, probability of the user's activity is computed. If the likelihood of user performing the activity is below the threshold value (i.e., determined using a method named Mathews correlation coefficient), a signal of anomaly alerts is generated. Each feature is conditionally independent of one another; therefore, final Gaussian probability density can be calculated by factorizing each feature's probability density.

Representing User Behavior Histogram for one dimension
2.3.
2 Eigen Value Decomposition: Here, our task in user profile generation is to identify interesting behavioral patterns for the users. To do the job,we can consider a combination of features and see how much one influences others. There can be two cases where if the data volume is large, abnormal patterns may not be noticed due to a huge number of normal patterns. Normal behavioral patterns can lie within very low dimensional subspace; thus, we can reduce the dimension of the dataset for better understanding of the user behavior pattern. There may be a case where there can be noise in the training dataset; therefore, it reduces the noise. Based on the data variance amount, principal component k that represents a 95% variance.So, we consider first k principal n components as normal subspace and remaining (n-k) is considered as abnormal subspace.While performing online anomaly detection, if user behavior is under normal subspace, it is considered normal, and if not so, an alarm is raised and to calculate whether the current activity of the user is normal or abnormal we
use Euclidian Distance method. Therefore, we have shown the below example to compute whether a user’s current activity is near normal or abnormal subspaces.
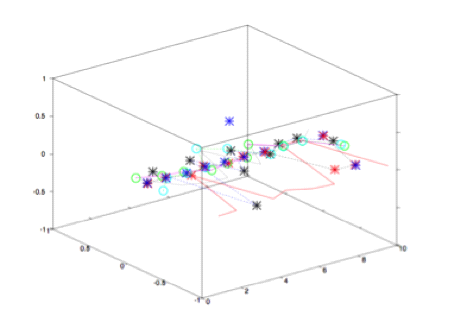
Representing important user behavior components
- Eagle Services
Following are the services provided by Apache Eagle:
3.1 Policy Manager: It provides a user interface and restful API to users for policy defining. It allows us to perform the following tasks:
- Mark or import sensitivity metadata
- Perform HDFS or Hive Resource Browsing
- To manage policies within a few clicks
- Accessing alert dashboards.
Following is the single evaluation policy query:
fromhiveAccessStream[senstivityType==’Phone_No’] select * insert into outputStream;
Here is the window based policy (one user accessing /tmp/private for 5 to 10 minutes)
hdfsAuditLogEventStream[(event src==

‘/tmp/private’)]#window.externalTime(timestamp,10 min) select

user,count(timestamp) as aggValue group by user having aggValue>=5

insert into outputStream;
3.2 Query Service: It provides SQL like service API to support comprehensive computation for a huge dataset like:
- Extensive Filtering
- Aggregation
- Histogram
- Sorting
- Arithmetic Expression etc.
As we know that Eagle supports HBase for data storage as a first-class citizen,it also supports a relational database.
Advantages of Apache Eagle
- Big data frameworks are fast moving creations; therefore, it is difficult to build reliable security around them. Thus, Eagle provides policy-based analysis and alerting like other projects like Apache Ranger.
- Helpful in analyzing user behavior
- Eagle also allows application data access to be classified as per the levels of sensitivity.
Summary
Apache Eagle has made it easy to secure the data by monitoring and identifying all type of data activities. It has made it easy for different Big Data platforms to maintain their security in a better way. Apache Eagle follows a vision similar to an Eagle bird, so named Apache Eagle.