D3.js Tutorial
Introduction of D3.js

D3.js is referred to as a JavaScript library that is used to manipulate the documents according to the data. The intensity of D3 is based on web standards that enable the ability of a modern browser, merging the powerful visualization elements and a method for DOM manipulation.
D3 exemplifies the Data-Driven Documents. D3 helps us to wrap the arbitrary data to a DOM (Document Object Model) and performs a data-driven transformation on the document. For Example- With the help of D3, you can create an HTML table by using the array of numbers and also use the same data to generate the interactive and smooth SVG (Scalable Vector Graphics) bar chart. D3 is not an imposing framework that provides convincing features. Instead, it provides the solution of problems such as data-based documents manipulation. D3 ignores the custody presentation and allows the flexibility to explore the abilities of web standards such as CSS, HTML, SVG, etc.
D3 contains minimal overhead, i.e., it is fast to use, supportable for large datasets, and dynamic for animation and interaction. The functional style of D3 helps us to reuse the code with the help of different sets of community-developed and official modules.
What is D3.js?
D3.js is an abbreviation for the term “Data Driven-Documents.” D3.js is used as an open-source framework introduced by Mike Bostock in 2011.
It is a JavaScript library that helps to generate interactive visualization. These visualizations are created in the browser. D3.js library facilitates the users to manipulate the webpage content into the collection of data. These webpages content can be HTML, SVG (Scalable Vector Graphics), CSS, and canvas elements. You can remove, edit, and modify the data collection according to the requirements.
D3 library allows performing manipulation of the DOM (Document Object Model). D3.js is an essential assist for data exploration. It also provides the facility to control the data representation and associate the interactivity. The concept of D3.js is similar to Protovis, but Protovis is used for static visualizations while D3.js is used for transformations, transitions, and interactions.
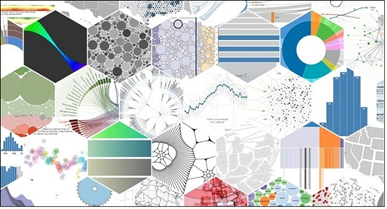
Today, it has become complicated to communicate with the massive amount of data generated by the users. In this case, the visual representation of data is a more conveying way to represent the information. D3.js provides great flexibility and an opportunity to visualize the data. It is innate, dynamic, and requires minimum efforts.
Need of D3.js
D3.js is a prime framework as compared to any other frameworks because of its ability to work on the web and excellent data visualization. It also has the flexibility that helps to work in a flexible manner. D3.js has good community support, and it is easy to implement.
D3.js can work with web technologies and manipulate the DOM object, but it is able to work with client-side technologies such as CSS, HTML, SVG, etc.
Features of D3.js
D3.js allows creating simple as well as complicated visualizations, including transition effects and user interactions. It is the best framework to create visualization.
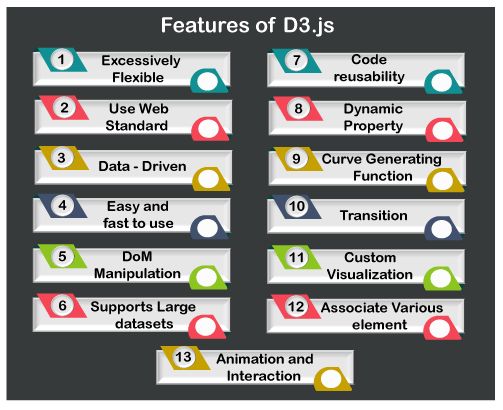
Here, we are going to discuss some features of D3.js along with the details:
- Excessively Flexible: D3.js is a robust system since it modifies data without any hindrance.
- It uses the web standard: D3.js is a dynamic or graphical visualization application used to generate the interactive data visualization. Many web standards are used to construct visualization such as CSS, HTML, and SVG.
- Data-Driven: It is a data-driven model.It can either obtain static data elements or retrieve them in a variety of formats such as XML (Extensible Markup Language), JSON, Object, Array to generate the charts.
- Easy and Fast to use: D3.js is straightforward to comprehend and quick information visualization applications.
- DOM Manipulation: D3.js helps to enhance the DOM (Document Object Model) according to the data type.
- Supports the Large Datasets: It supports the large datasets. D3.js enables users to work with an information source with significant amount of content.
- Animation and Interactions: D3.js facilitates the users to create the animation with the help of some functions such as delay(), ease(), duration(), etc. It is very convenient to move the animations from one state to another state.
- Code Reusability: D3.js offers the freedom to use equivalent code elsewhere without rewriting.
- Dynamic Properties: D3 platform offers dynamic characteristics to its functions that tend to make it customizable. You can use your attributes and styles to drive the data.
- Curve generating functions: D3 paradigm has a wide array of functions that help to establish the various types of Curves.
- Transition: D3.js module supports the function called transition(). It is a versatile function used to operate between the user-defined values and intermittent states.
- Custom Visualizations: D3 tools make it easier to work with network standards. It provides full influence over the data visualization.
- Associates various elements in the html page: This interface allows you to connect various data components to a single web page.
Audience
This tutorial helps you to learn the fundamentals of D3.js from the basics. The tutorial contains various chapters. Each chapter consists of the topics wrapped with easily understandable examples and explanations.
This tutorial helps the beginners to learn the D3.js in an easy way. The tutorial is also for professionals who want to learn the online data visualization and make career in this field.
Prerequisites
Before moving to the tutorial and its several aspects, you must have the awareness about the frameworks and certain key points. You must have the sufficient and necessary knowledge of JavaScript, HTML, and CSS. The basic knowledge of JavaScript is necessary because D3.js is a library of JavaScript.
D3.js Index
- What is D3.js
- Environment setup of D3.js
- Concepts of D3.js
- Data Join in D3.js
- Selection in D3.js
- Animation in D3.js
- Introduction to SVG
- SVG Transformation
- Graph in D3.js
- Drawing Charts in D3.js
- Drawing a circle in D3.js
- Drawing a Pie Chart in D3.js
- Geographies in D3.js
- Array API in D3.js
- Collection API in D3.js
- Selection API in D3.js
- Axis API in D3.js
- Colors API in D3.js
- Data Loading in D3.js
- Delimiter-separated API in D3.js
- Dragging API in D3.js
- Event Handling in D3.js
- Function of data in D3.js
- Paths in D3.js
- Requests API in D3.js
- Scales API in D3.js
- Shapes API in D3.js
- Timer API in D3.js
- Transition API in D3.js
- Zooming API in D3.js