Debugging ASP .Net
Debugging
Debugging enables programmers to see how the Code works step-by-step, how the variables ' values change, how objects are created and destroyed, and so on. Debugging is the application's method of inserting breakpoints. Such breakpoints are used to pause running a program from running.
Let's take an example of a program to understand Debugging. The program displays a string “debugging is running" to the user.
Here in the example, we're going to use our ' DataProject' generated in previous chapters. In the following example, we'll see
- How to show a string for the demo request.
- How to create an interface breakpoints
- Use this Breakpoint to debug the query.
Step 1:- Ensure we have opened our visual Studio and ensure our project file is open.
Step 2:- Open WebForm1.aspx.cs File and write code.
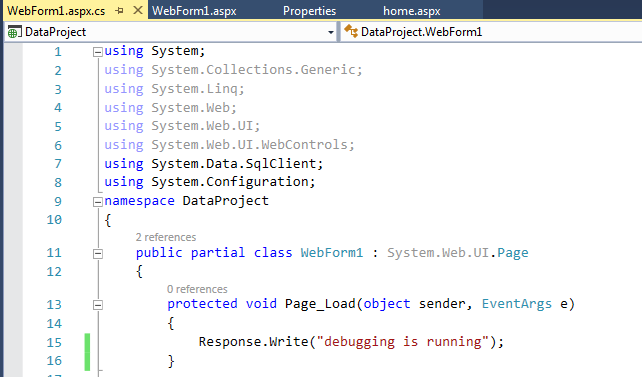
namespace DataProject
 {
   public partial class Demo : System.Web.UI.Page
                                {
                                  protected void Page_Load(object sender, EventArgs e)
                                  {
                                    Response.Write("debugging is running");
                                  }
                                }
 }
Step 3:- Now, we will add a breaking point. Add Response. Write anywhere in the program where you want to break the program.
You can also add multiple Breakpoints in a program.
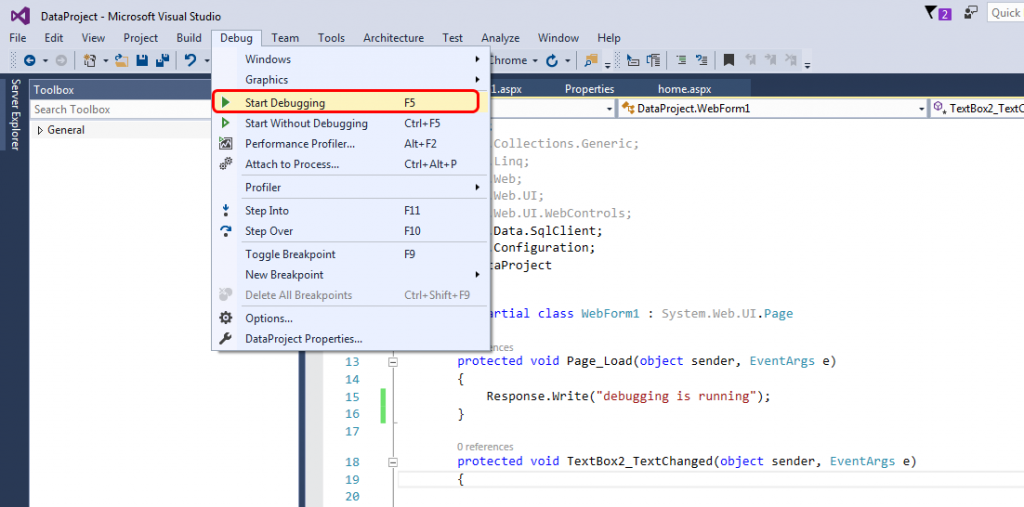
Step 4:- Now, you have to run your program in Debug mode. For Debug, choose the menu option Debug and click on Start Debugging.
Output:-
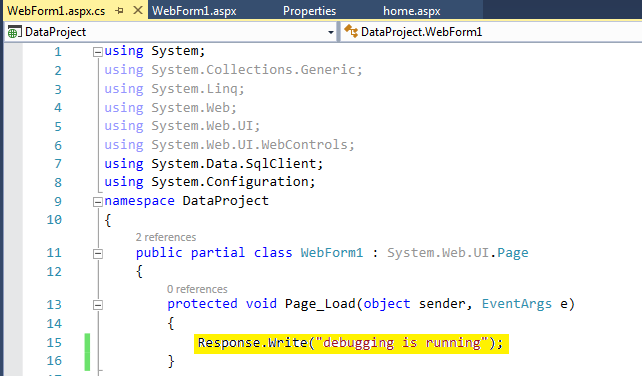
- When all the steps of the Debug execution is completed, then visual studio marks breakpoint yellow as you see in last snap. If the programmer feels that the Code is incorrect, the execution can be stopped.
Tracing
Tracing is an operation to follow the execution path and show on the webserver the diagnostic information related to a specific Asp. Net web page or program. Tracing tracks irregular incidents during the execution of an application. It helps during training and after delivery to identify problems. In the case of unusual trace log events, an application may write a message using Trace class. ASP.NET tracing allows you to view a single request diagnostic information for an ASP.NET page.
By default, tracing is disabled in Asp. Net. Trace statements are only executed when tracing is allowed and displayed. Tracing in two levels can be allowed.
- Page-Level Tracing
- Application Level Tracing
Let's look at how to enable an application to track.
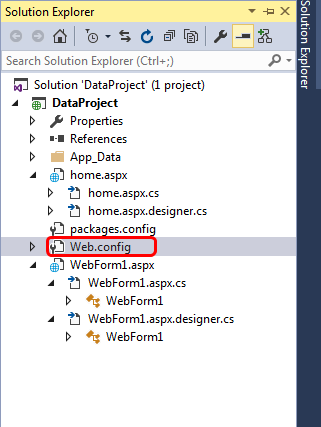
Step 1:- Open the web.config file of your project.

Step 2:- Now add the below Code in the file.
<system.web>
     <compilation debug="true" targetFramework="4.5.2"/>
     <httpRuntime targetFramework="4.5.2"/>
   <trace enable="true" pageOutput="false" requestLimit="50" localOnly="false"/>
   </system.web>
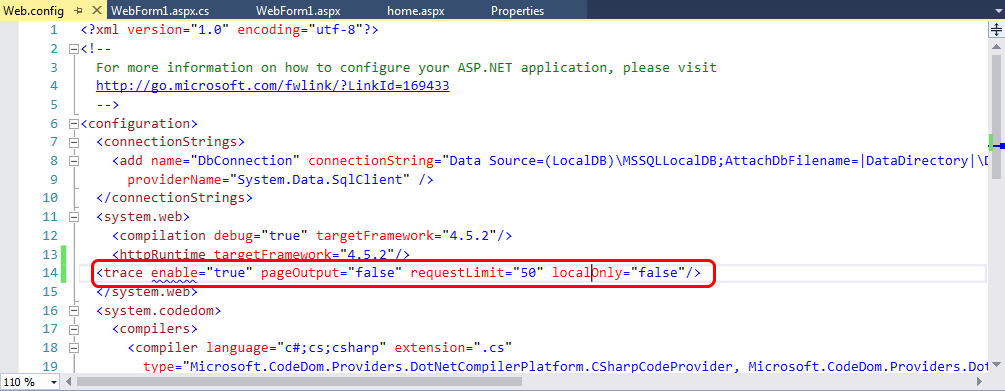
- “RequestLimit” is used with a trace tag to specify the number of pages to be traced.
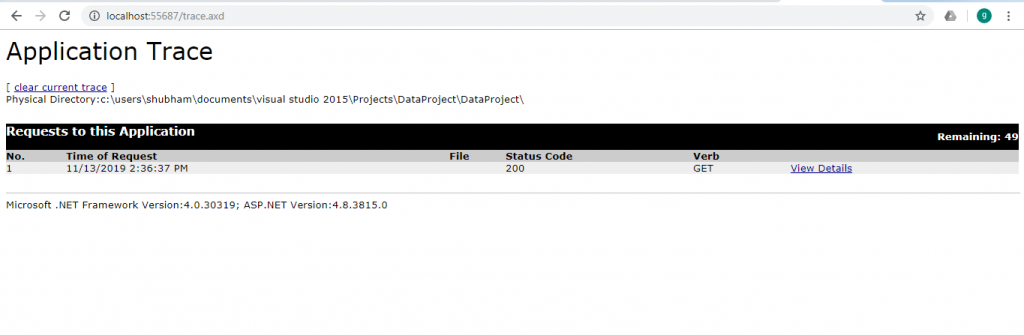
Step 3:- Run Your Project for output.
Output:-
Page-Level Tracing
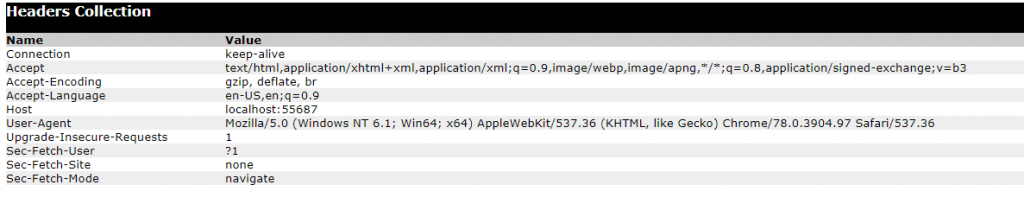
We can control tracing by enabling or disabling for the individual pages. Page-Level tracing includes some information such as:
- Information query (time, sort, code status).
- Size (in bytes) necessary for page processing and each command.
- Timing information for the page's lifecycle critical points.
- Information about cookies sent to the server.
- HTTP headers for the server.
- Form data.
- State of the session and demand connected with the request
- Strings of the query sent with the request
- All variables on the server
Let’s take an example to see how to enable page-level tracing:-
Step 1:- Let's work on our data project. Open the WebForm1.aspx file from the Solution Explorer.
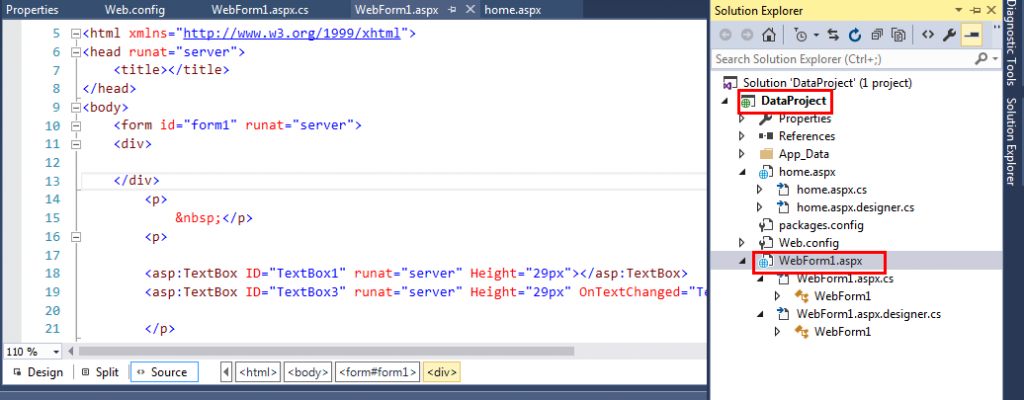
Step 2:- Add the below Code of Code to enable page tracing.
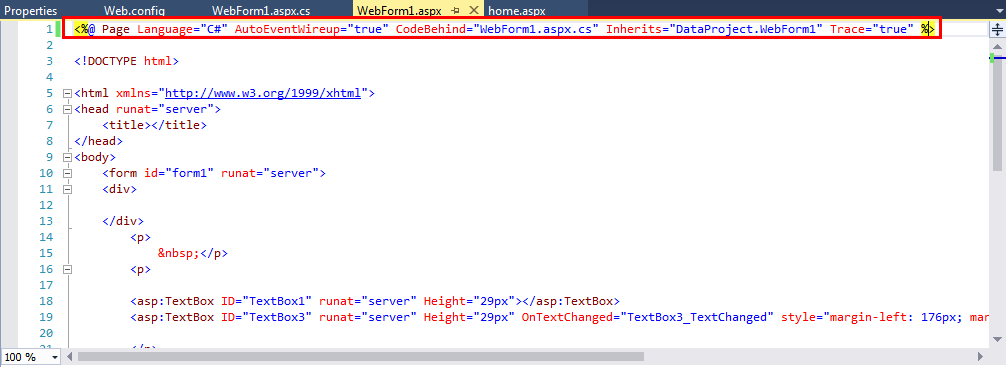
<%@ Page Language="C#" AutoEventWireup="true"
CodeBehind="WebForm1.aspx.cs" Inherits="DataProject.Demo"
%>
    <!DOCTYPE html>
 <html xmlns="http://www.w3.ore/1999/xhtml">
 <head runat="server">
    <title></title>
  </head>
  <body>
   <form id="form1" runat="server”>
  </form>
  </body>
  </html>
Output:-
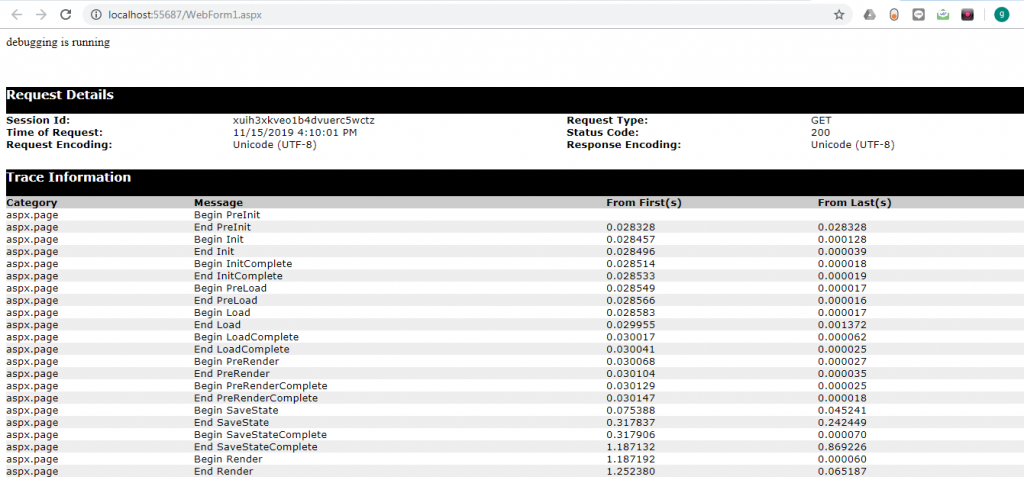
Here you will get complete information about the page.