Pipeline run details view - Jenkins
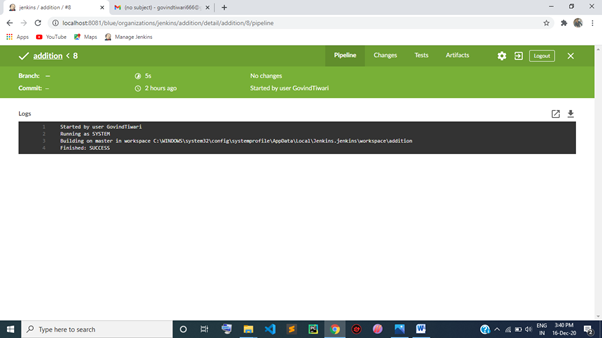
Pipeline run details view: Blue Ocean's pipeline run details view section displays all the details about a single pipeline run. This section also allows you to make a modification in that run or restart that run. Here are some features (options) and details of the "pipeline run details view" section given below:
- Run Status: This section shows the run status of the pipeline run. It uses the run status icon to display the status.
- Pipeline name: It displays the name of the currently running pipeline.
- Run number: It is a unique ID number allotted by Blue Ocean to each branch and the pipeline's pull request.
- Tab selector: There are four tabs available in this section. Each tab provides information about the pipeline run. These tabs are:
- Pipeline: It is a default tab means pre-selected tab. It shows overall actions that happen with the pipeline run. It displays each stage of that pipeline run; the steps in the stages show the screen's result, which comes from those steps.
- Changes: If the run is failed or unstable, then you make changes from this tab. When you click on the edit sign, it takes you to the changes tab and allows you to make modifications in that run.
- Tests: This tab displays information about the test result of the pipeline run. If your current pipeline run has some error, then it will show the result information via the following four sections:
- Fixed: It shows the total number of errors that you solved.
- New failure: In resolving an issue, you may get some new errors. In that case, it shows the total number of new errors that have been found.
- Failure: It shows the total number of tests that have been failed in the pipeline's execution.
- Passing: It shows the total number of tests that have been cleared or passed in the pipeline.
It also displays the description of the errors that have occurred.
And in the second case, if your pipeline run is error-free, then it will display double right-click with the following quote:
"All tests are passing.
Nice one! All (n) tests for this pipeline are passing."
Here 'n' is the total number of tests.
- Artifacts: If you save an artifact with the help of the "Archive Artifact" process, this section shows all artifacts you saved. You can download them also from here by clicking on an item available in this list.
- Re-run sign: It is a symbol. The re-run symbol is denoted by an anti-clockwise arrow "?. " You can run the pipeline again from here that have been completed, just by clicking on the icon.
- Edit sign: This symbol is denoted by a pencil (similar to a pencil) icon "$. " When you click on this symbol, it will open the "Pipeline editor" for that specific run's pipeline.
- Exit button: This exit button is denoted by an arrow in a square box. By clicking on this, you will exit from the Pipeline run details view and be redirected to the "Classic" UI view of the details for this run.
- Close button: It is also a symbol denoted by a cross "×." When you click on this icon, it closes the pipeline's details view and switches you to the "Activity View" section of this pipeline.
- Branches/Pull Request: You can filter the current pipeline run according to the branch or pull requests by clicking on the drop-down tab. This drop-down has only two options: Branches and Pull Request. You can sort them as per your requirements.
- Commit: Here, the commit information being provided related to the current pipeline run.
- Duration: This section shows the execution time of the pipeline run. It displays the total time taken by pipeline run in completing the execution process.
- Completed time: This section displays how long it took to complete or abort the pipeline run.
- Change Author: You can change the Author's name from here.
- Tab view: This is a section where all the details of the selected tab will be displayed.