How to create Histograms in R
R Histograms
A Histogram is the graphical representation of the distribution of numeric data. It takes only one numeric variable as input. The variable is cut into several bars (also called bins), and the number of observation per bin is represented by the height of the bar. Note that, the shape of the histogram can be different following the number of bins we set. To plot a histogram, we use one of the axes as the frequency or count of values and another axis as the range of values divided into buckets. R provides a hist() function which is used to create histograms. This function takes a vector as an input with some parameters to plot histograms.Syntax:
hist(v,main,xlab,xlim,ylim,breaks,col,border)Here, v is a vector containing numeric values main is the title of the chart col is for color of the bar or bins border is for border color xlab is the description of the x-axis xlim is the range of values on the x-axis ylim is the range of values on the y-axis breaks are used to specify the width of each bar
Example:
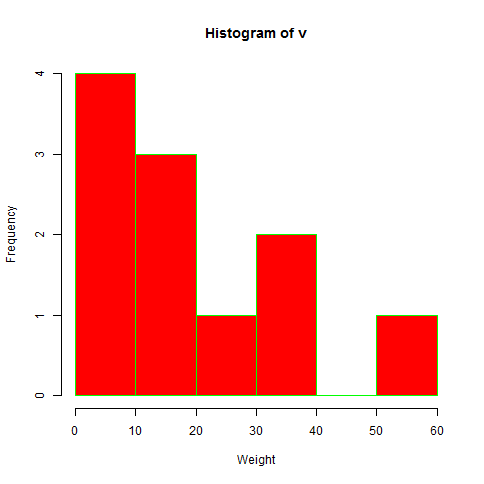
Let’s create a simple histogram using input vector, label, col and border parameters.
# Create data for the graph.
v <-  c(12,10,12,9,2,33,12,51,21,33,10)
# Give the chart file a name.
png(file = "histogram.png")
# Create the histogram.
hist(v,xlab = "Weight",col = "red",border = "green")
# Save the file.
dev.off()
Output:
Range of x and y values
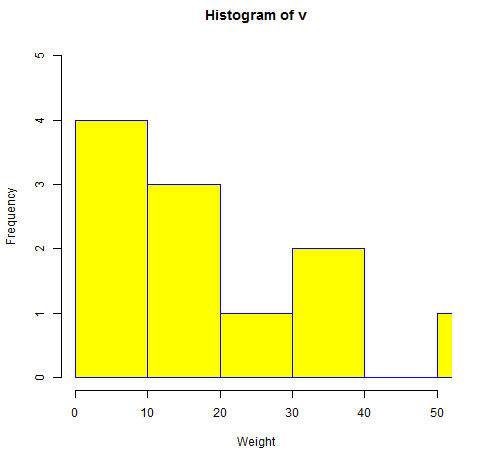
xlim and the ylim parameter are used to set the range of values in x-axis and y-axis respectively.
Example:
Let's see an example:
# Create data for the graph.
v <- c(12,10,12,9,2,33,12,51,21,33,10)
# Give the chart file a name.
png(file = "histogram_lim_breaks.png")
# Create the histogram.
hist(v,xlab = "Weight",col = "yellow",border = "blue", xlim = c(0,50), ylim = c(0,5),
breaks = 5)
# Save the file.
dev.off()
Output:
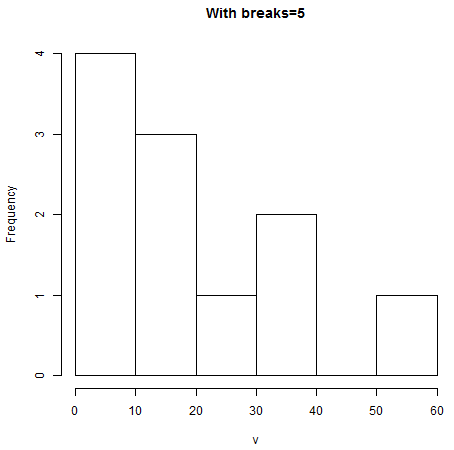
Histograms with different breaks
We can specify the width of the bar through the breaks parameter. Example 1: Let's see an example to create a histogram with 5 breaks.# Create data for the graph. v <- c(12,10,12,9,2,33,12,51,21,33,10) # Give the chart file a name. png(file = "histogram_breaks5.png") # Create the histogram. hist(v, breaks=5, main="With breaks=5") # Save the file. dev.off()Output:
Example 2:
Let's see another example to create a histogram with 20 breaks:
# Create data for the graph.
v <- c(12,10,12,9,2,33,12,51,21,33,10)
# Give the chart file a name.
png(file = "histogram_breaks20.png")
# Create the histogram.
hist(v, breaks=20, main="With breaks=5")
# Save the file.
dev.off()
Output:

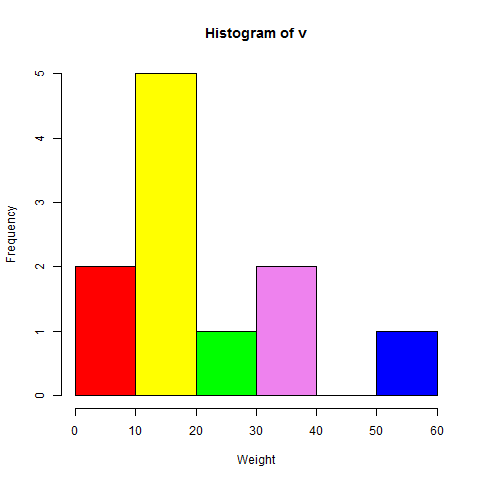
Bins with different Color
Example:
# Create data for the graph.
v <- c(12,10,12,9,2,33,12,51,21,33,10)
# Give the chart file a name.
png(file = "histogram_col.png")
# Create the histogram.
colors = c("red", "yellow", "green", "violet", "orange", "blue", "pink", "cyan")
hist(v, right=FALSE, col=colors, main="Histogram of v", xlab="Weight")
# Save the file.
dev.off()
Output: