UML State-Chart diagram
State-Chart diagram
State-Chart diagram clarifies the state of a function in a system, as its name suggests. These are also used to define the state machines. A state machine is a machine that specifies a variety of states of an object. A special kind of state-chart diagram is named as an activity diagram. The main objective of this diagram is to specify the flow of control from one state to another. One of the main benefits of this diagram is forward and reverse engineering.
- It is also called a State machine diagram or state transition diagram, which represents the sequence of states inside the system.
- It depicts the software system’s behavior.
- It describes the behavior of a complete system, a subsystem, a package, and a class.
- The state-Chart diagram bears out for being an adequate way of designing the collaborations and interactions within an external entity and a system.
- It describes many different states of the components inside a system.
- Every component or object contains a particular state.
Types of the State-Chart Diagram
These diagrams are of two types, which are discussed as follows:
Behavioral
This state-chart diagram documents the object’s behavior inside the system. It portraysan execution of a specific entity. It also designs the behavior of a system.
Protocol
It is another type of state-chart diagram. It grasps the protocol’s behavior. It captures the modification in the protocol state and parallel modification inside the system. But these diagrams do not depict the execution of a specific component.
Importance of State-Chart Diagram
Its primary goal is to portray every state of a single object. It demonstrates the entities and an interactive system within the system. It evidences the system’s dynamic nature.
- It designs a reciprocal system, which can be feedback to the intramural events or external events.
- The implementation flow from a state to another state is demonstrated through a state-chart diagram.
- It envisions the state of an object from its initiation to completion.
- As it documents the system’s dynamic behavior, it depicts the nature of the software application.
- During a lifecycle, an object goes through various states, and the lifecycle endures as far as the operation is running.
- All the states portray helpful information about an object.
Notation of the State-Chart Diagram
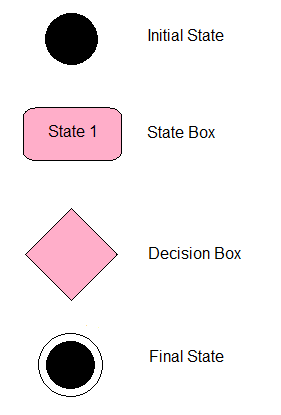
Initial State
This notation describes an initial state of the system. It can be shown by the filled circle.
State-Box
It portrays the circumstances or conditions of a specific object of the class at a particular moment. A rectangle, along with round corners can represent it.
Decision-Box
Decision-Box can be displayed by a diamond shape to be created on a calculated guard basis.
Transition
A transition can be viewed as the control change through one state to another state as a result of the existence of any event. A transition can be represented by a labeled arrow with the event as the modification has ensued.
Final State
This notation shows an end state of the system. The final state can be displayed by a small filled circle pose inside a circle.
State Types
These diagrams contain three different states, which are discussed below:
- Simple State- These diagrams do not establish any sub-states. Also, it does not include any region and submachine states.
It has some compartments which are as follows-
- Name
- internal transitions
- internal activities
- Composite State- These states contain sub-states. Sub-states might be sequential (disjoint) or concurrent (orthogonal). UML 2.4 describes these states, just like those states which include more than one region. A state can’t have both sub machines and regions.
Compartments are as follows:
- Name
- internal transitions
- decomposition
- internal activities
- Submachine State- It illustrates the specification insertion of a submachine state machine. The state-machine that includes a submachine state could be known as a containing state machine. These states are quite similar to composite states. The submachine state’s regions are the composite state’s region. The internal transitions, behavioral actions, entry, and exit are described as a part of a state.
Drawing of State-Chart Diagram
These diagrams can be used to depict several states go through an object. The modification in various states is a result of the existence of any event. Before going to draw a state-chart diagram, every state of a specific component should be recognized.
The events, states, and objects should be endorsed before the execution of a state-chart diagram. It mainly concentrates on various states of the system. These states define a critical role while creating state transition diagrams.
Here are some essential key points when we draw these diagrams:
- An understandable and unique name must be referred to as a state transition that defines the nature of a system.
- In the state-chart diagram, only the most necessary objects are executed.
- A legitimate name must be assigned to the transitions and the events.
When to Use State-Chart Diagram
It executes the object-oriented as well as real-world systems. It demonstrates the dynamic nature of a system, which helps to distinguish between the static and dynamic nature of the system. It also visualizes how provoking an event may cause a modification inside the system.
Uses
- It can be used for executing forward engineering as well as reverse engineering.
- It can be used for identifying the events culpable for the state transitions.
- As it composed of reactive projects, it can be used for designing various reactive systems.
- It can also be used for creating the states of an object of the system.
Difference between State-Chart Diagram and Flow-Chart
| State-Chart Diagram | Flow-chart |
| It illustrates several states of the system. | It represents the flow of program execution. |
| It contains a WAIT mechanism in which it has a feature to wait for an event or an action. | It does not contain any wait concept. |
| It can be helpful to live functioning systems. | It visualizes a branching order of the system. |
| These diagrams are the modeling diagrams. | It is the order flow or data flow diagrams. |
| It can disclose various states of the system. | It deals with paths and control flow. |
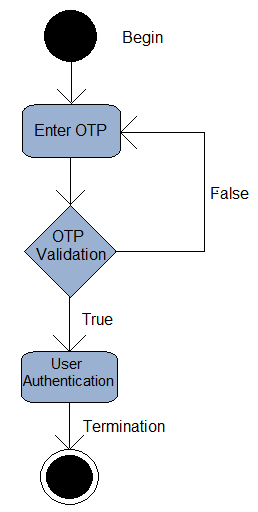
Example of State-Chart Diagram
Following diagram illustrates the authentication process of the user: