Statistics Tutorial for Data Science
Statistics is a science of collecting, organizing, presenting, analyzing, and interpreting data to help in making a more effective decision.
Before starting with this tutorial, you should have a basic understanding of Mathematics.
Why is Statistics Important?
Statistics is important because today we live in the information world, and much of the information is determined mathematically with the help of Statistics.
Example:
- The researcher uses statistical concepts. They use their statistical skills for collecting the appropriate data.
- In the field of finance, Statistics are the key to how traders and people in business invest their money.
- We use Statistics concepts for quality testing. Companies make many products, and every company should make sure that they sell the best quality of products but companies do not test all the products, so they use statistics.
- Statistics allow us to collect information around the world.
- Statistics play a vital role in the field of medical science. Before any medicine prescribed, the scientist must show a statistically valid rate of effectiveness.
Types of Statistics
There are two types of statistics:
- Descriptive Statistics
- Inferential Statistics
Descriptive Statistics: Descriptive statistics is a method of organizing, summarizing, and presenting the data in an informative way.
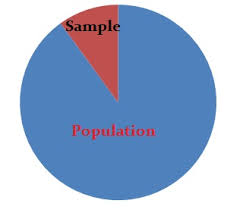
Inferential Statistics: Inferential statistics is a method used in determining something about a population based on a sample.
- Population: Population is the collection of all individuals or items under consideration in a statistical study. It can be finite or infinite.
Example:
Students of javatpoint.
All stars in the universe.
- Sample: Sample is a subset of the population.
Example:
Students who study java at javatpoint.
1200 voters selected at random for interview.
Introduction to Basic Terms:
- Variable: Characteristic or condition that has different values for a different individual element of a population.
There are two types of variable in statistics:
- Qualitative Variable: Qualitative ->Quality
It deals with descriptions that means data that can be observed but not measured.
Example:
Colors, smells, etc.
- Quantitative Variable: Quantitative -> Quantity
It deals with numbers that mean data that can be measured.
Example:
Length, Area, etc.
- Data
(Singular): It may be a
number, a word, or a symbol.
- Data (Plural): It is the measurement and observation of a variable.
- Statistics: It is a numerical value that summarizes the sample data.
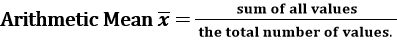
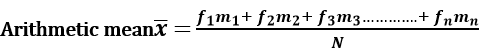
Arithmetic Mean: The arithmetic mean is calculated by adding up all the values and dividing those values to the total numbers of values.
The arithmetic mean is represents byx? and read it as x bar.
There are three types of series to calculate the arithmetic mean:
- Individual Data Series
- Discrete Data Series
- Continuous Data Series
Individual Data Series: In this series, data is given on individual basis.
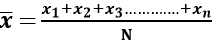
Where
x? = the mean.
x1 = the first value.
x2 = the second value.
x3 = the third value.
xn = the last value.
N= Sum of all values.
Example
Problem Statement:
Calculate the arithmetic mean for following individual data series given below:
| Items | 10 | 25 | 15 | 30 | 20 | 50 |
Solution:
The given data, we have:
10, 25, 15, 30, 20, 50.
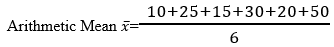

=25
The arithmetic mean of the given numbers is 25.
Discrete Data Series: In this series, data is giving along with their frequencies.
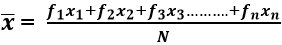
We can write same formula as follows:

Where
N = Numbers of observations.
ƒ1 , ƒ2 , ƒ3 ,...., ƒn = Different values of frequency.
x1 , x2 , x3 ,...., xn = Different values of variable .
Example
Problem Statement:
Calculate the arithmetic mean for following discrete data given below:
| Items (?) | 10 | 12 | 16 | 20 | 14 | 15 |
| Frequency (ƒ) | 3 | 5 | 1 | 0 | 2 | 6 |
Solution: The given data, we have:
| Items(?) | Frequency(ƒ) | ƒ? |
| 10 | 3 | 30 |
| 12 | 5 | 60 |
| 16 | 1 | 16 |
| 20 | 0 | 0 |
| 14 | 2 | 28 |
| 15 | 6 | 90 |
| N = 17 | ?ƒ?= 224 |
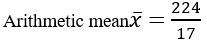
= 13.17
The arithmetic mean of the given numbers is 13.17.
Continuous Data Series:In this series, the data is given based on ranges along with their frequencies.
In the case of continuous series, mid-point (m) calculated as 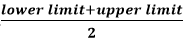
The arithmetic mean of continuous data series can be calculated using formula -
We can write the same formula as follows:

Where
N = Number of Observation.
ƒ1 , ƒ2 , ƒ3 ,...., ƒn = Different values of frequency.
m1 , m2 , m3 .... ... ... mn = Different values of mid-points.
Example
Problem Statement:
Calculate the arithmetic mean of the following continuous data given below:
| Items | 0 - 10 | 10 - 20 | 20 - 30 | 30 - 40 | 40 – 50 |
| Frequency | 2 | 4 | 1 | 3 | 5 |
Solution:
The given data, we have:
| Items | Mid-point(m) | Frequency(ƒ) | ƒm |
| 0 - 10 | 5 | 2 | 10 |
| 10 - 20 | 15 | 4 | 60 |
| 20 - 30 | 25 | 1 | 25 |
| 30 - 40 | 35 | 3 | 105 |
| 40 - 50 | 45 | 5 | 225 |
| ?ƒ= 15 | ?ƒm = 425 |
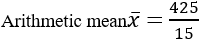
= 28.33
The arithmetic mean of the given numbers is 28.33.
Arithmetic Median
The arithmetic median is the middle value in a given set of values. To find the median arrange the numbers in ascending order, and then choose the value in the middle.
The arithmetic median is represented by "M."
There are three types of series to calculate the arithmetic median:
- Individual Data Series
- Discrete Data Series
- Continuous Data Series
Individual Data Series: In this series data is given on individual basis.
Median for even number of series:
Where –
N = Number of Observation.
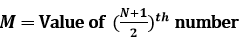
Median for the odd number of series:
M = Value of the middle number.
Example 1:
Problem Statement:
Calculate the arithmetic median for following individual data given below:
| Items | 12 | 18 | 20 | 24 | 30 | 32 |
Solution:

= Value of 3.5th number
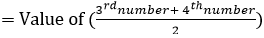
The Arithmetic Median of given numbers is 22.
Example 2:
Problem Statement:
Calculate the arithmetic median for following individual data given below:
| Items | 12 | 18 | 20 | 24 | 32 | 40 | 48 |
Solution:
Given series contain 7 numbers, an odd number thus the middle
Number in this series is Arithmetic Median, i.e., 24.
Discrete Data Series: In this series, data is giving along with their frequencies.
Example 1:
Case 1: For even series-
Problem Statement:
Calculate the arithmetic median for following discrete data given below:
| Items | 12 | 18 | 20 | 24 | 30 | 32 |
| Frequency | 3 | 5 | 2 | 1 | 4 | 6 |
Solution:

= Value of 3.5th number
The Arithmetic Median of given numbers is 22.
Example 2:
Case 2: For odd series-
Problem Statement:
Calculate the arithmetic median for following discrete data given below:
| Items | 12 | 18 | 20 | 24 | 32 | 40 | 48 |
| Frequency | 5 | 3 | 2 | 1 | 4 | 9 | 6 |
Solution:
Given series contain 7 numbers, an odd number thus the middle number in this series is Arithmetic Median, i.e., 24.
Continuous Data Series:In this series, the data is given based on ranges along with their frequencies.
The arithmetic median of continuous data series can be calculated using formula -
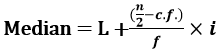
Where

c.ƒ = Previous commutative frequency of median class.
ƒ = frequency of median class.
i = interval of the median class.
n = total number of observation.
Example
Problem Statement:
Calculate the arithmetic median for following continuous data given below:
| Items | 0-10 | 10-20 | 20-30 | 30-40 | 40-50 | 50-60 | 60-70 |
| Frequency | 7 | 18 | 34 | 50 | 35 | 20 | 6 |
Solution:
| Items | Frequency | cƒ |
| 0-10 | 7 | 7 |
| 10-20 | 18 | 25 |
| 20-30 | 34 | 59 |
| 30-40 | 50 | 109 |
| 40-50 | 35 | 144 |
| 50-60 | 20 | 164 |
| 60-70 | 6 | 170 |
| ?ƒ = 170 |
L = 30
c.f. = 59
f = 50
i = 10
= 35.2
The Arithmetic Median of given numbers is 35.2.
Arithmetic Mode
The arithmetic mode is a value that occurs most frequently.
The arithmetic mode is represents by "M0 ".
There are three types of series to calculate arithmetic mode:
- Individual Data Series
- Discrete Data Series
- Continuous Data Series
Individual Data Series: In this series, data is giving on an individual basis.
Example
Problem Statement:
Calculate the arithmetic mode for following individual data given below:
| Items | 12 | 28 | 25 | 20 | 128 | 45 | 20 |
Solution:
The Arithmetic Mode of the given numbers is 20 as it repeated the maximum number of times, i.e., 2.
Discrete Data Series: In this series, data is given along with their frequencies. In discrete series, the arithmetic Mode is calculate by finding the variable which has the highest frequency associated with it.
Example:
Problem Statement:
Calculate the arithmetic mode for following discrete data given below:
| Items | 15 | 120 | 117 | 78 | 95 | 25 |
| Frequency | 12 | 15 | 10 | 9 | 14 | 11 |
Solution:
The Arithmetic Mode of the given numbers is 120 as the highest frequency, 15 associated with it.
Continuous Data Series: In this series, the data is given based on ranges along with their frequencies.
Arithmetic mode of continuous data series can be calculated using formula –
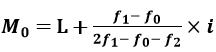
Where –
M0 = Arithmetic Mode.
L = Lower limit of modal class.
ƒ0 = Frequency of class preceding modal class.
ƒ1 = Frequency of modal class
ƒ2 = Frequency of class succeeding modal class.
i = Class Interval.
Model class: It is the class that has the highest frequency.
Example
Problem Statement:
Calculate the arithmetic mode for following continuous data given below:
| Items | 0-10 | 10-20 | 20-30 | 30-40 | 40-50 | 50-60 |
| Frequency | 5 | 8 | 6 | 10 | 4 | 1 |
Solution:
L= 30
ƒ0 = 6
ƒ1 = 10
ƒ2 = 4
i = 6
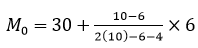
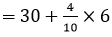
= 30 + 2.4
= 32.4
Arithmetic mode of given numbers is 32.4.
Measures of Dispersion: It is information on the spread and variability of the data value.
The commonly used dispersion measures include:
- Range
- Variance and standard deviation
Range: The range is the difference between the largest and the smallest observation in the sample.
The following formula gives the arithmetic range:
Range = L - S
Where –
L = Largest item
S = Smallest item
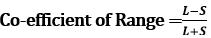
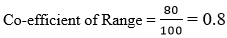
Co-efficient of Range: Co-efficient of a range is given by-
Example
Problem Statement:
What is the range and range coefficient for the following set of numbers?
| 20 | 40 | 10 | 45 | 15 | 65 | 55 | 90 |
Solution:
Sort the numbers in ascending order.
| 10 | 15 | 20 | 40 | 45 | 55 | 65 | 90 |
Largest Number = 90
Smallest Number = 10
Range = 90-10
= 80
Largest + Smallest = 90 + 10 = 100
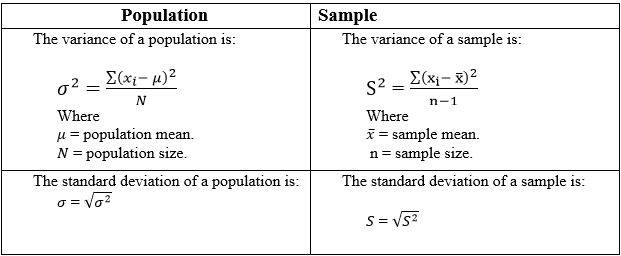
Sample variance: It is the arithmetic mean of squared deviations from the sample mean.
Let x1 , x2 , x3 ... ... xn random sample from a population. Than sample variance is:
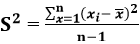
Where
S2= sample variance.
xi = ith element of the sample.
x? = mean of the sample.
n =sample size.
Example
Problem Statement:
Find the sample variance of the following numbers given below.
| Numbers | 4 | 10 | 12 | 15 | 9 |
Solution:
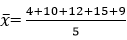

x? = 10
| xi | (xi - x? ) | (xi - x? )2 |
| 4 | (4 - 10) =-6 | 36 |
| 10 | (10 - 10) = 0 | 00 |
| 12 | (12 - 10) = 2 | 04 |
| 15 | (15 - 10) = 5 | 25 |
| 9 | (9 - 10) = -1 | 01 |
| ?(xi - x? )2 =66 |
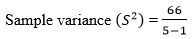

= 16.5
The sample variance is 16.5.
Standard Deviation: It is the square root of sample variance denoted by S.
(S) ?S2=
Where
(S2) = Standard variance.
Example:
Problem Statement:
Consider the above problem statement where the standard variance is 16.5. Then calculate the value of the standard deviation.
Solution:
S = ? 16.5
= 4.06
The standard deviance is 4.06.
Difference between Population and Sample:
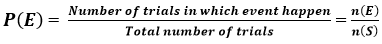
Probability: It is the chance of something happening. Its range lies between [0-1].
Event (E) : Number of trial events can happen.
Sample Space (S) : Total numbers of trials.
Example
Problem Statement:
A coin tossed 10 times. Heads occur 4 times, and tail occurs 6 times. What is the probability of getting a head?
Solution:
Number of trials in which event happens = 4
Total number of trials = 10

Probability - Additive Theorem
Mutually Exclusive Event: Event in which only one outcome can happen at any one time.
Example 1: A coin can be tossed either head or tail occur, not both
Mathematically, it is calculated using formula-
P ( A or B) = P(A) + P(B)
P ( A ? B) = P(A) + P(B)
Example 2
Problem Statement:
What is the probability of drawing an ace or a king from a standard deck of cards?
Solution:
P (ace or king) = P(ace) + P(king)


Non-Mutually Exclusive Event: Event in which more than one outcome can happen at any one time.
Example 1: A die rolled, and a number 6 occur then, it could be both even and a multiple of three.
Mathematically, it is calculated using formula-
P ( A or B) = P(A) + P(B) - P(A and B)
P ( A ? B) = P(A) + P(B) - P(A ? B)
Example 2
Problem Statement:
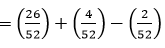
When drawing a card from a deck of 52 cards. What is the probability of getting a red card or a queen?
Solution:
P = (Red or queen) = P(Red) + P(queen) - P (Red ? queen)


Probability – Multiplicative Theorem
Independent Event: Two events were said to be independent of each other when the probability that one event happens does not affect the probability of the other event happen.
Example 1: Tossing a coin and rolling a number cube is an independent event.
Mathematically, it is calculated using formula-
P (A and B) = P(A) x P(B)
P (A ? B) = P(A) x P(B)
Example 2
Problem Statement:
A coin tossed twice, what is the probability of getting a head and then a tail?
Solution:
P ( H1 ? T2) = P(H1) x P(T2)


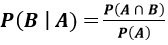
Dependent Event: Two events are said to be dependent on each other when the probability that one event happens, affects the probability of the other event occurs.
Example 1: Taking out a ball from a bag containing some balls and not replacing it, and then taking out a second ball.
Mathematically, it is calculated using formula-
P (A and B) = P(A) x P(B | A)
Where
Bayes Theorem: Bayes Theorem finds the probability of an event based on the other things that we know.
Bayes Theorem is:
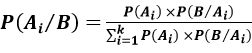
Where A1, A2...Ai… are set of n mutually exclusive events.
Example
Problem Statement:
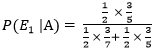
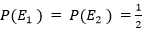
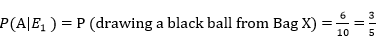
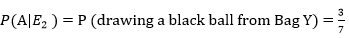
Bag X contains 4 white and 6 black balls while another Bag Y contains 4 white and 3 black balls. If one ball is drowned random from one of the bags, and it is found to be black. Find the probability that ball is drawn from Bag X.
Solution:
E1 = Event of choosing the bag X.
E2 = Event of choosing the bag Y.
A =Event of choosing a black ball.
Bayes' theorem. –