How to Use Tableau Dimensions and Measures?
Tableau is very built on the premises of drag and drops so let’s developed a simple visualization and talk about what each of these shells and marks card specifically do so we are going to make a simple chart.
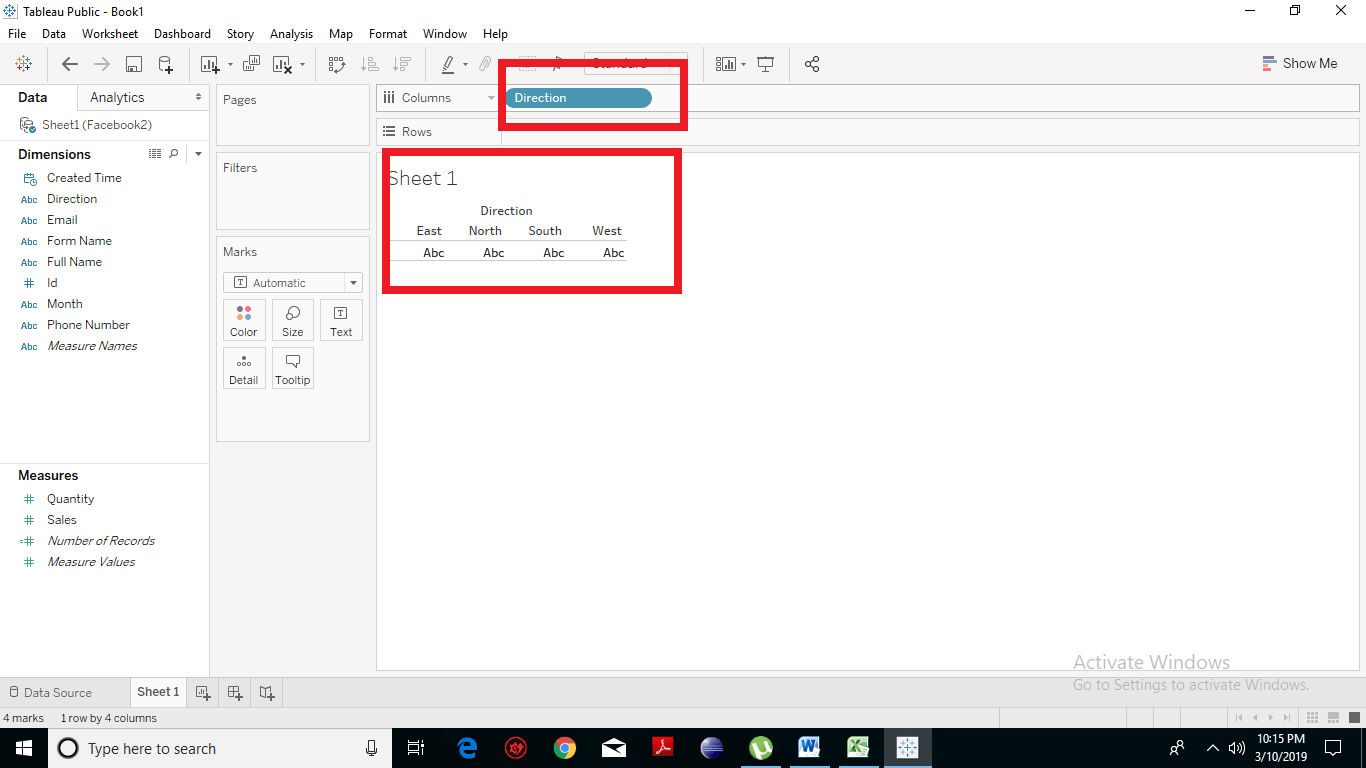
As discussed before dimensions are on top and measures are on the bottom. Dimensions are used to reveal details in your data that is qualitative details. We also have a measure which contains numeric quantitative values. Measures can be aggregated and when you drag a measure on to the view, tableau will automatically apply an aggregation to that measure, or we can say its sum by default.
We will grab direction, and we’ll see its four distinct values (east, west, north, and south) as a dimension.
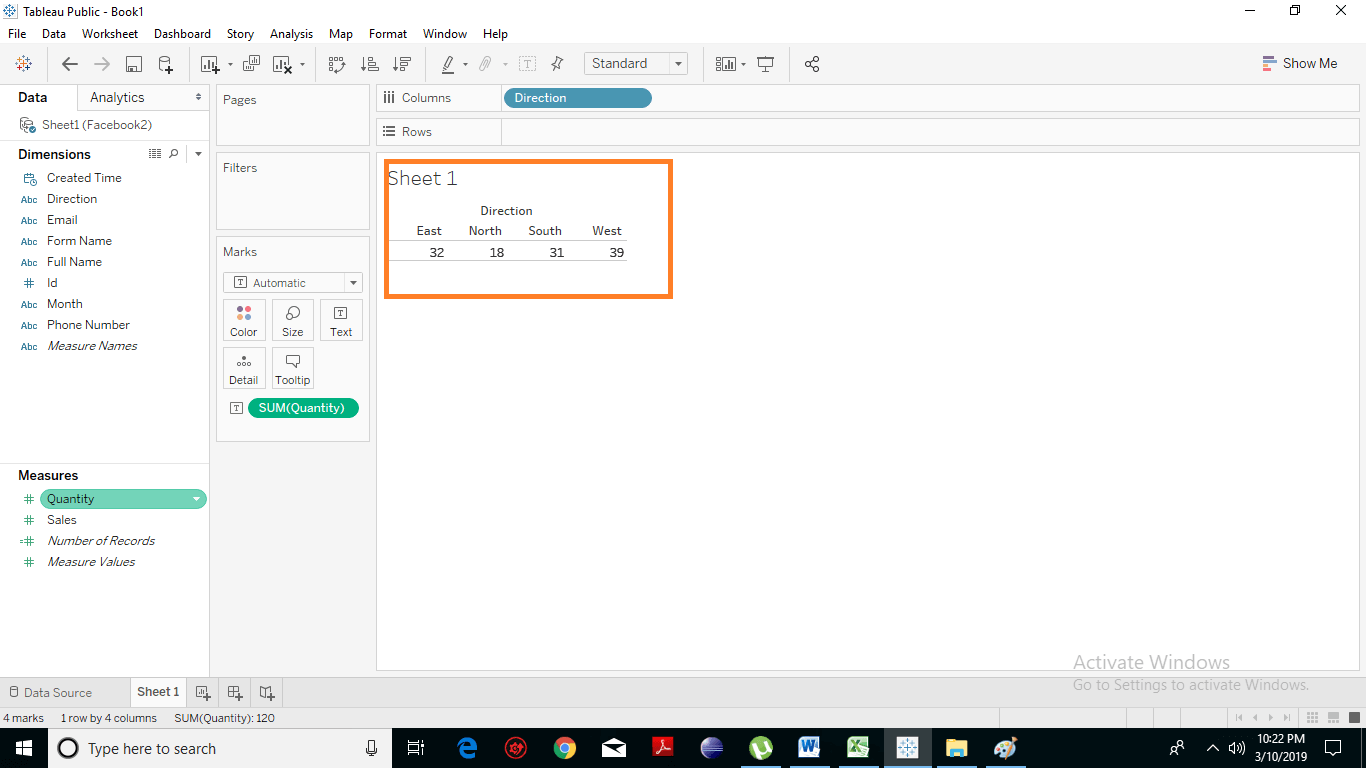
Then we’ll double click on quantity, and we can see the numbers here the measures. You can see below that it is the sum of quantity.
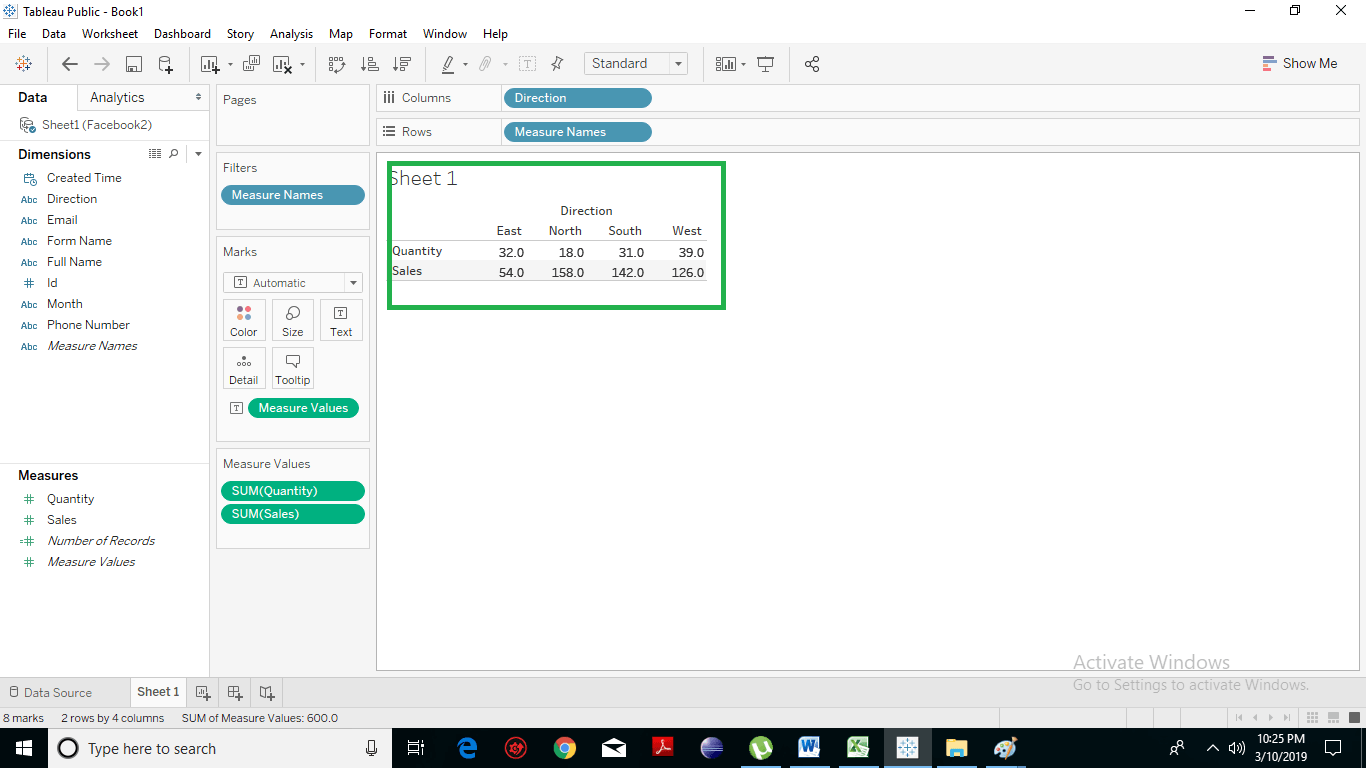
Now, we can also double click on sales, and you can see both the sums of quantity and sales.
Let’s discuss a little bit about dimension and measures.
In general, measures are numbers and dimensions, but sometimes like ID.
So a question arises, that why would we have a number up here in Dimension instead of in the measures?
Tableau is smart enough that when it sees ID, it knows that it belongs up in the dimensions at once won’t be aggregating or adding the ID.
Let’s make a new sheet and make visualization, so we can bring on quantity and we’re going to use it as a dimension. Right click on the quantity, and select it dimension.
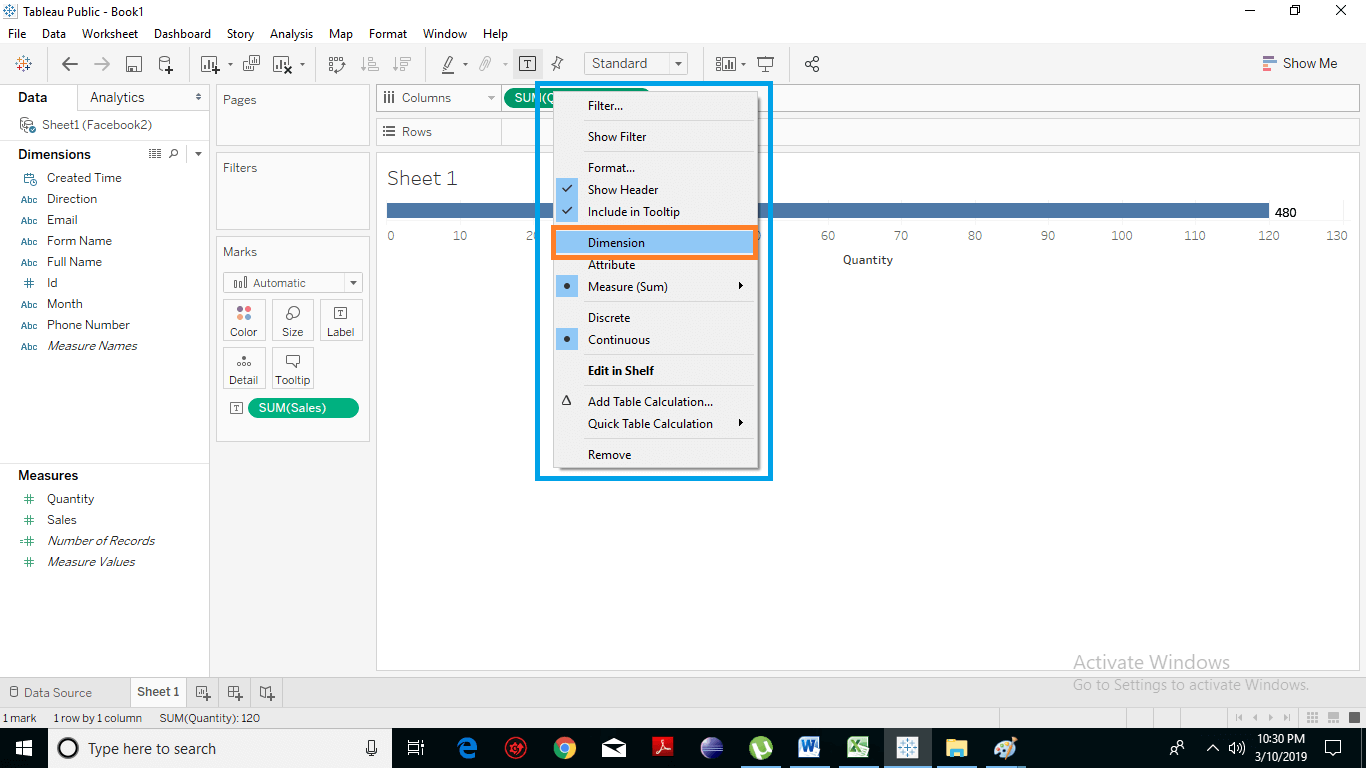
You can see even when it’s dimension you can choose continuous or discrete. Let’s choose continuous option.
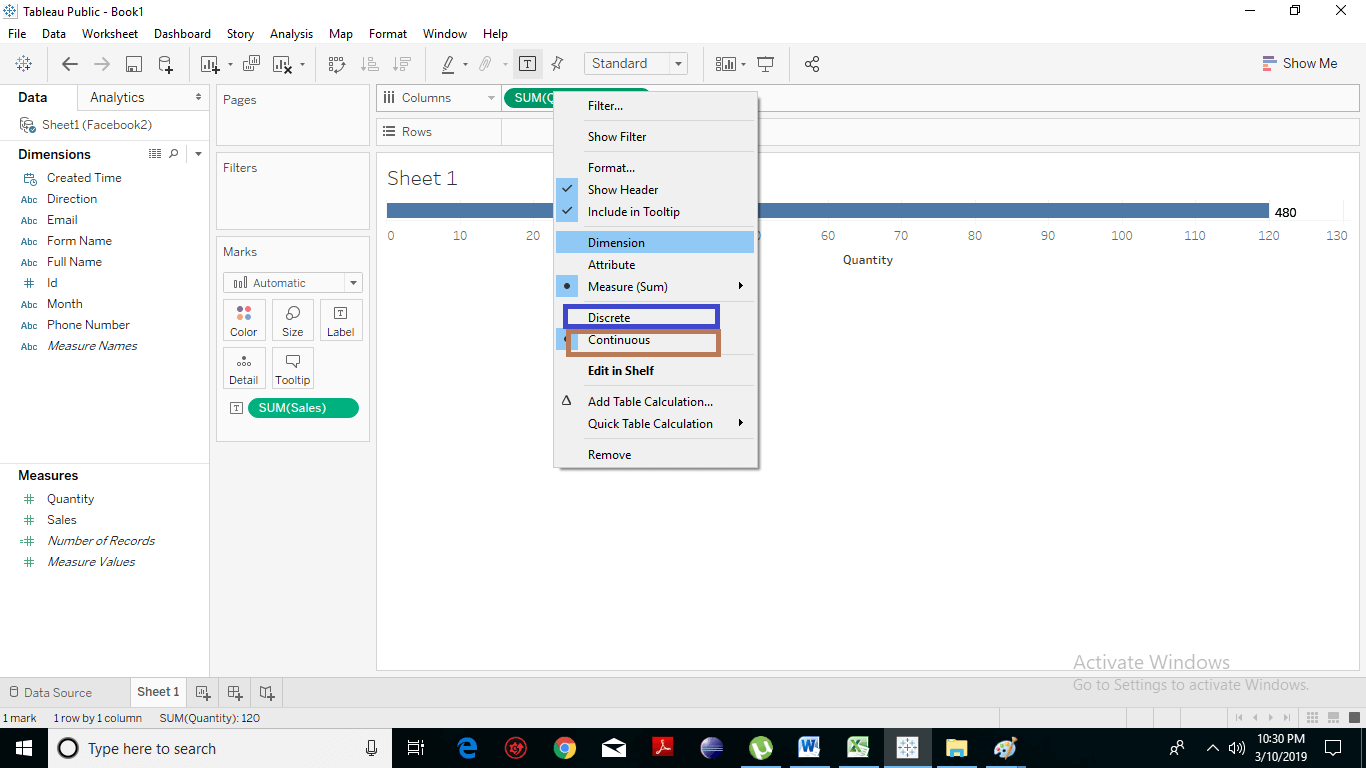
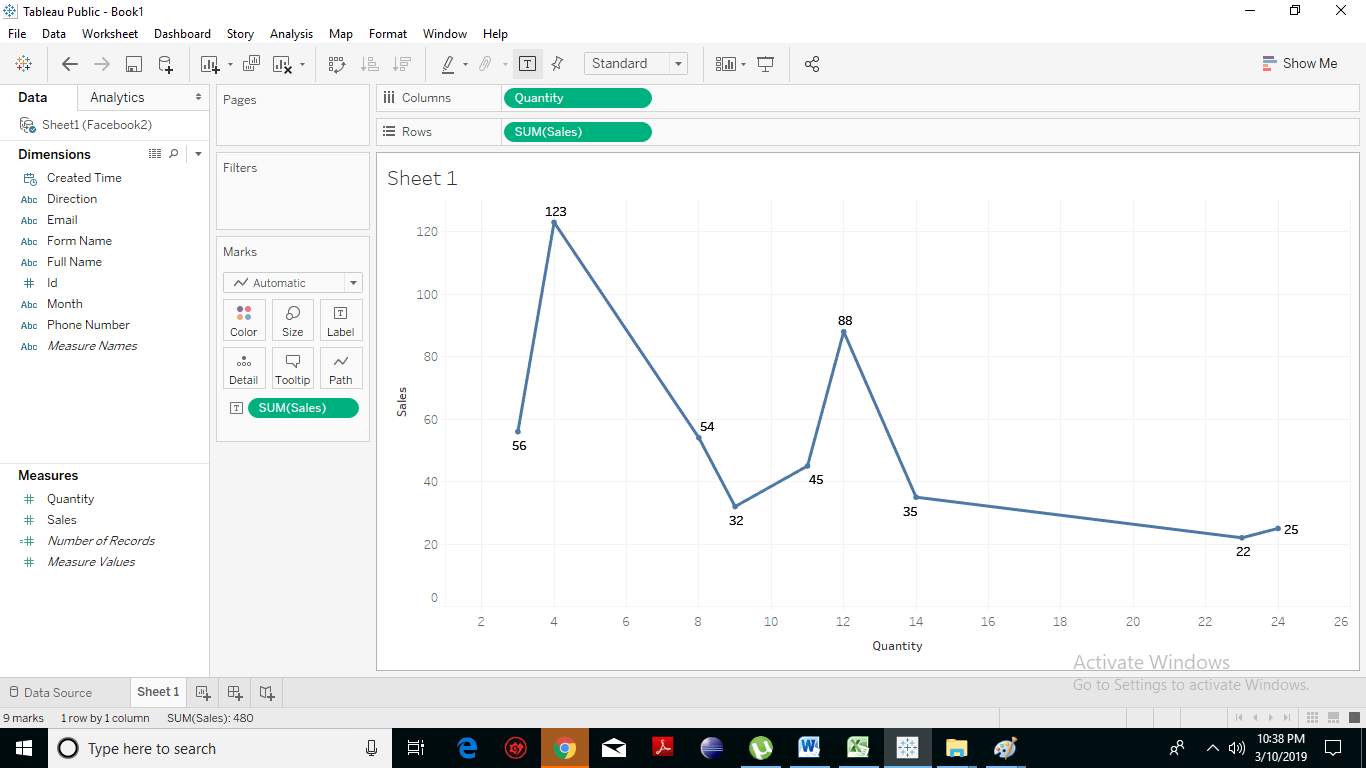
So right now it’s a dimension but its green a little bit different than what you might expect and then we’ll drag the sales in the Rows filed. So now we can see over the different quantities what our sales were. It has been for this last period that we’re looking at. We can see that this is an axis and its range from 1 to 26.
Now, if we change it from continuous to discrete. Right click on quantity and click on discrete.
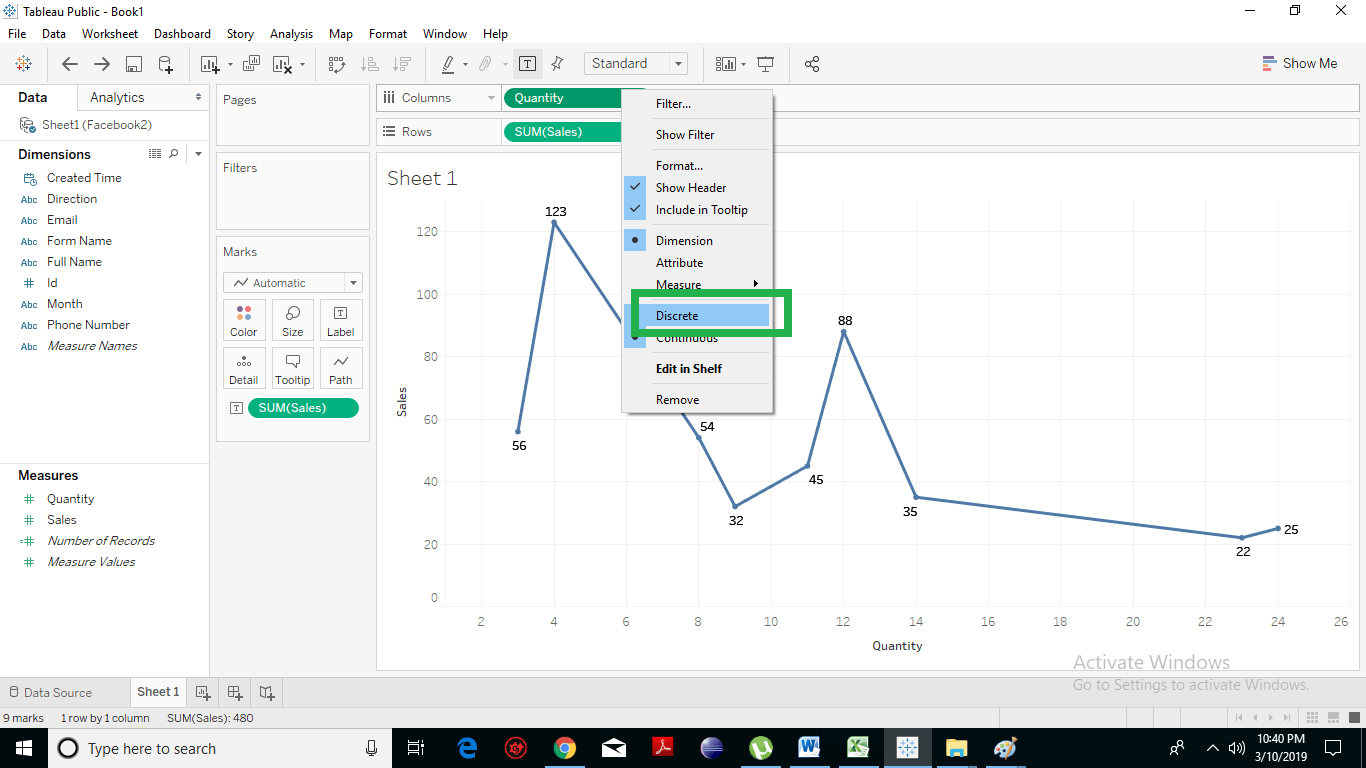
Now, you can see that 1 is a label and it’s not an axis ranging from 1. It doesn’t even have 15 because there are no values under 26. These are just individual labels.
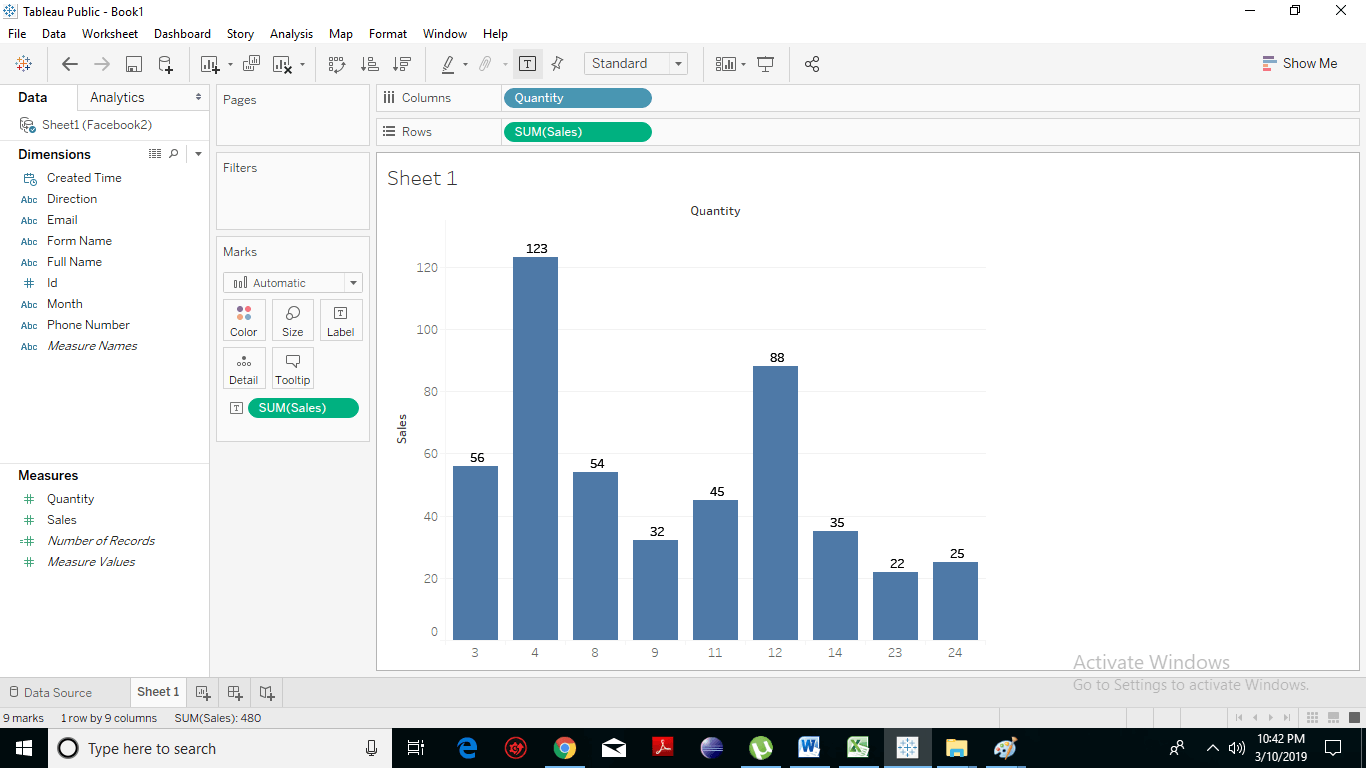
These differ in different quantity numbers, and at the top, we have our sorting.
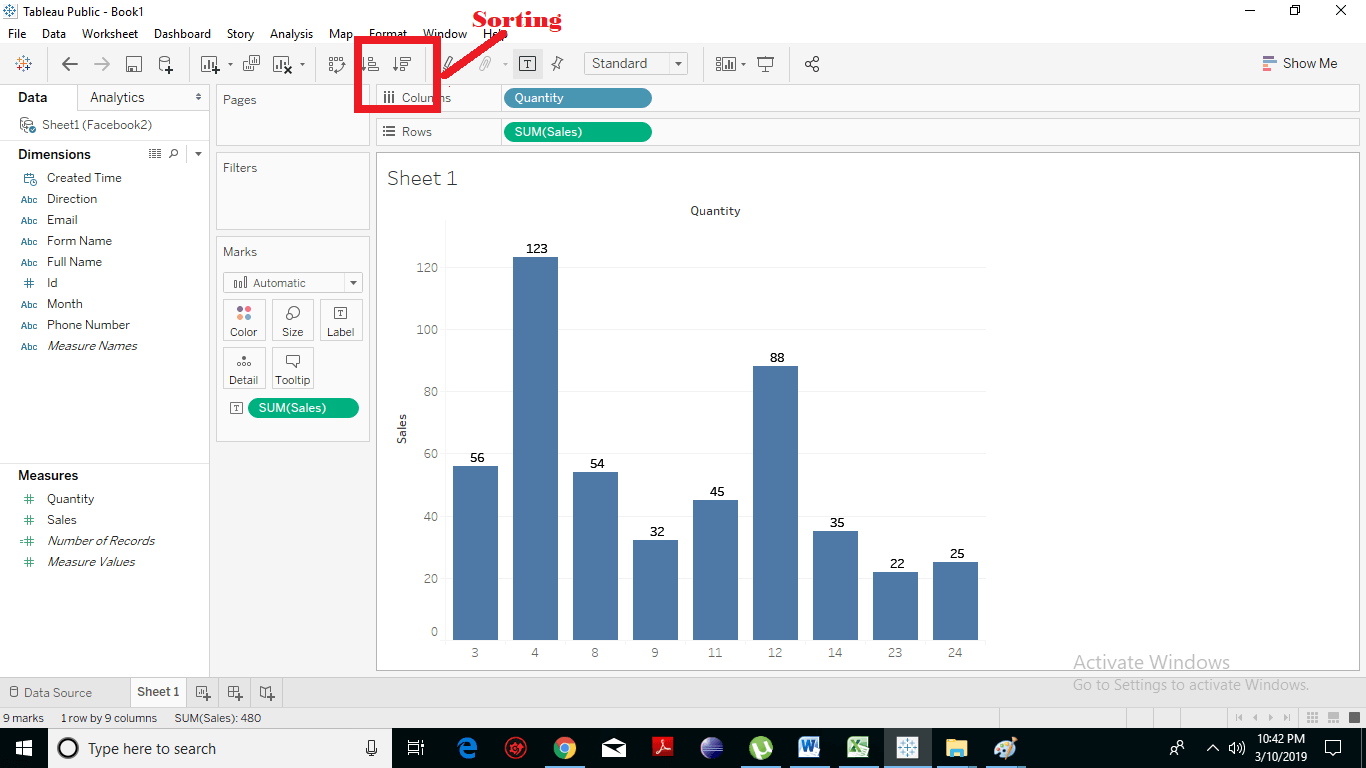
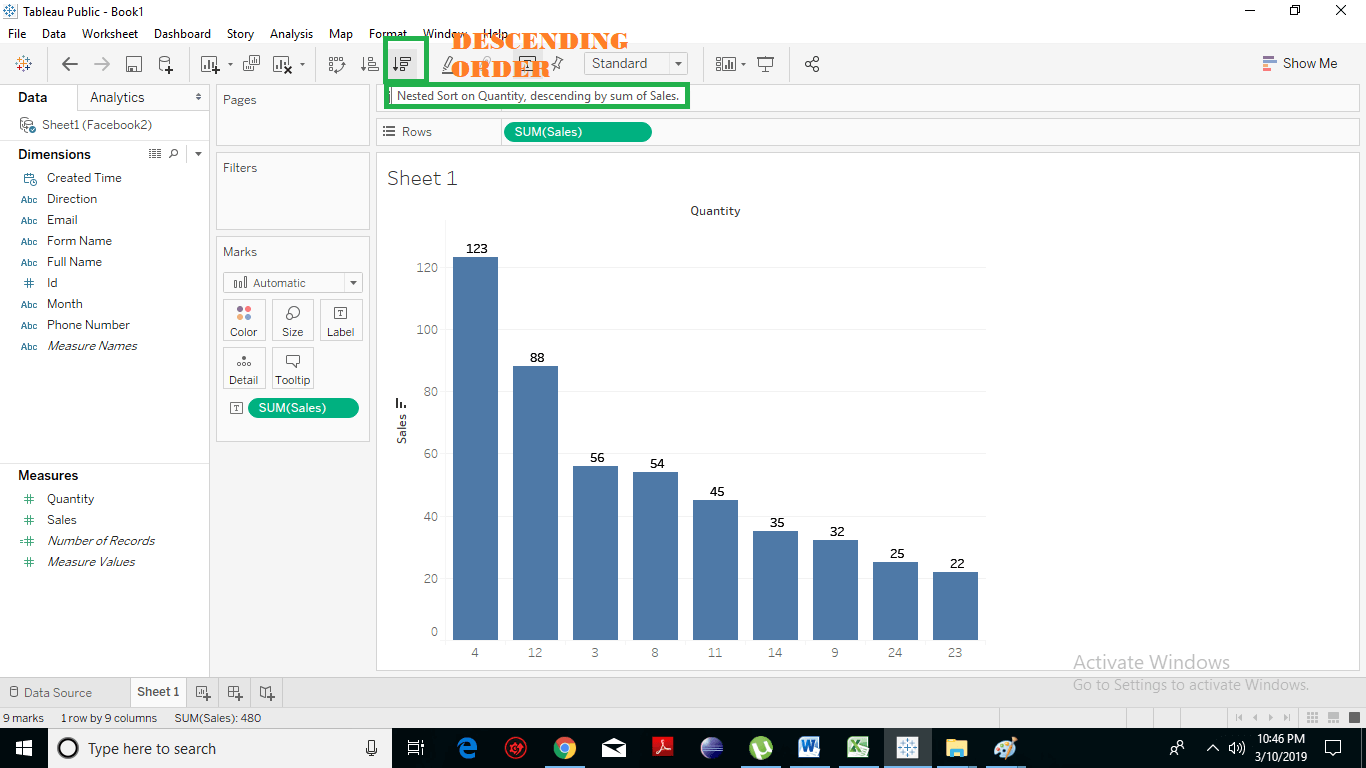
When you hover over this, it tells you what kind of sorting is going to happen. So we can sort quantity descending by sales so we can see that when they buy three things, we add the highest sales.
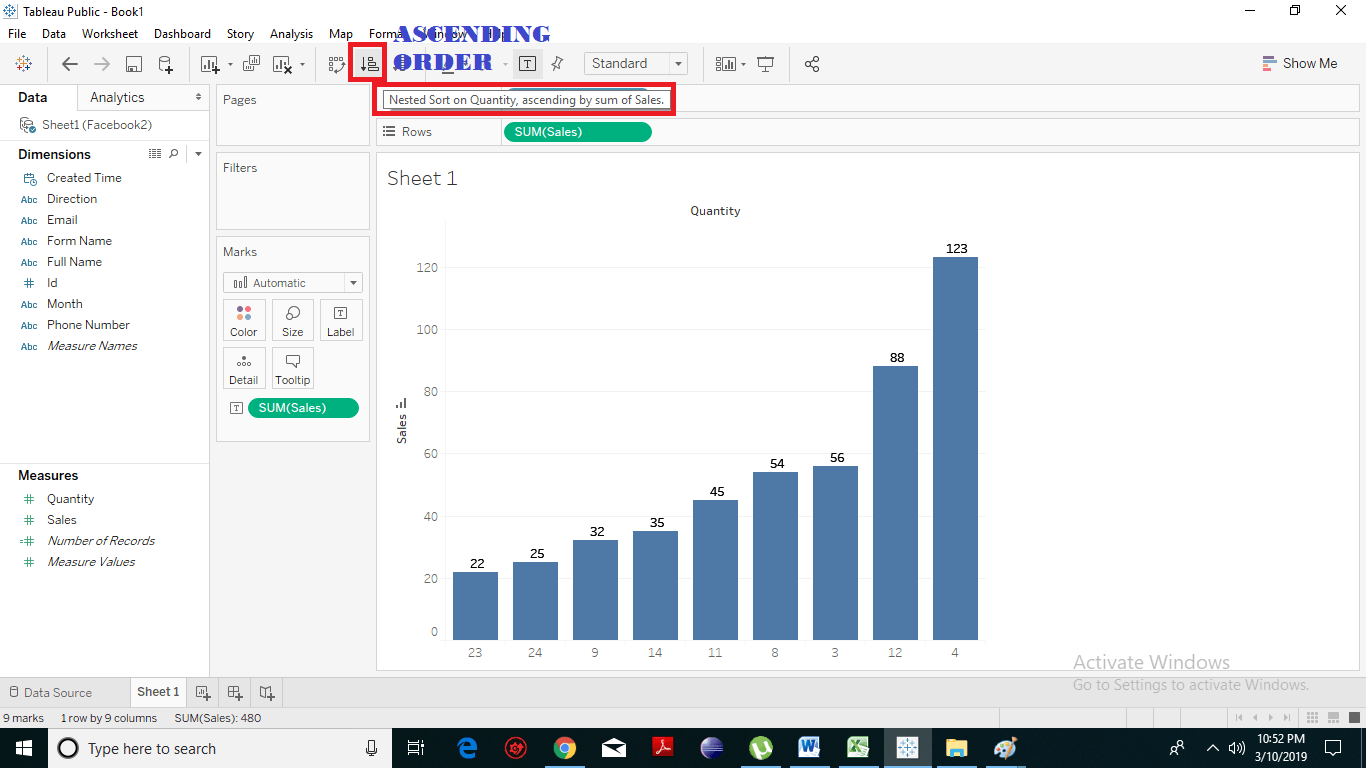
We can also do the opposite, where it’s the lowest to the highest number of sales.
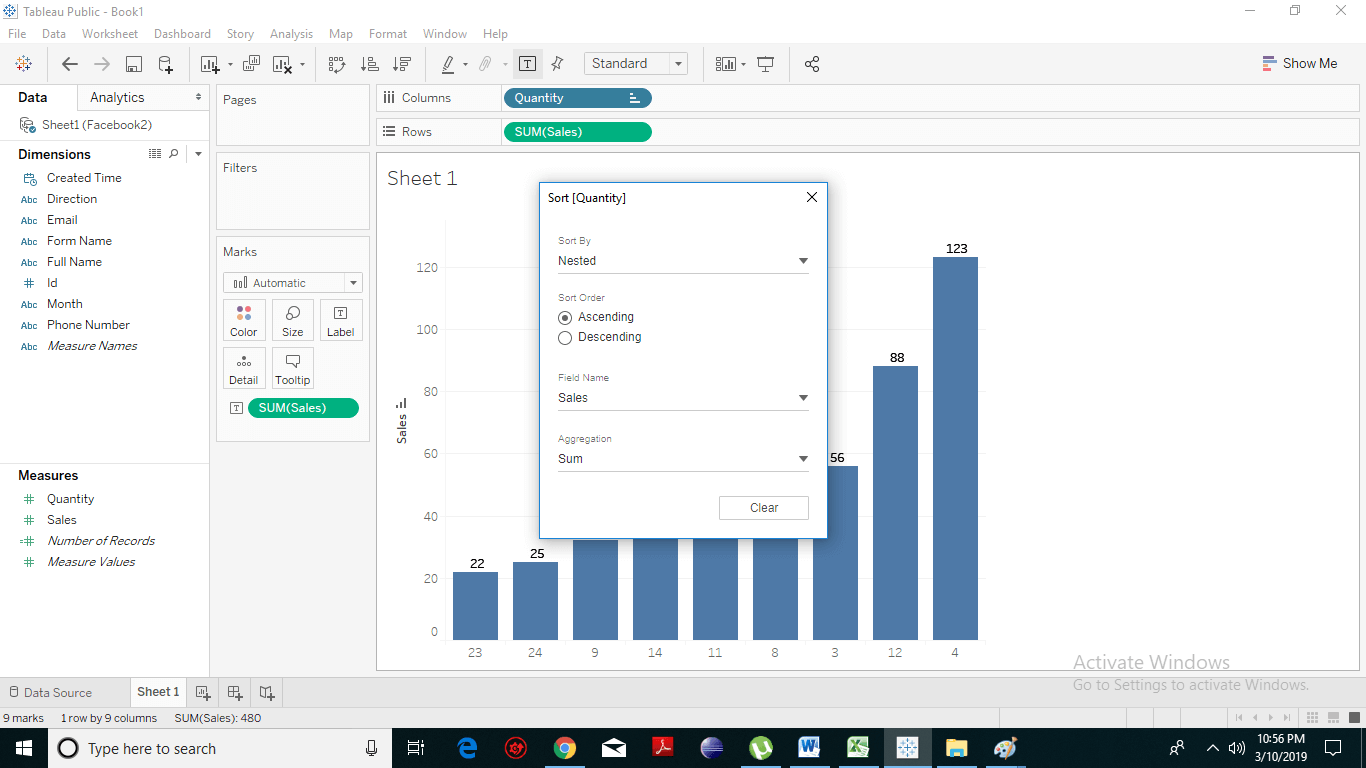
You can also do sorting in-depth by clicking on the quantity and right click on sort.
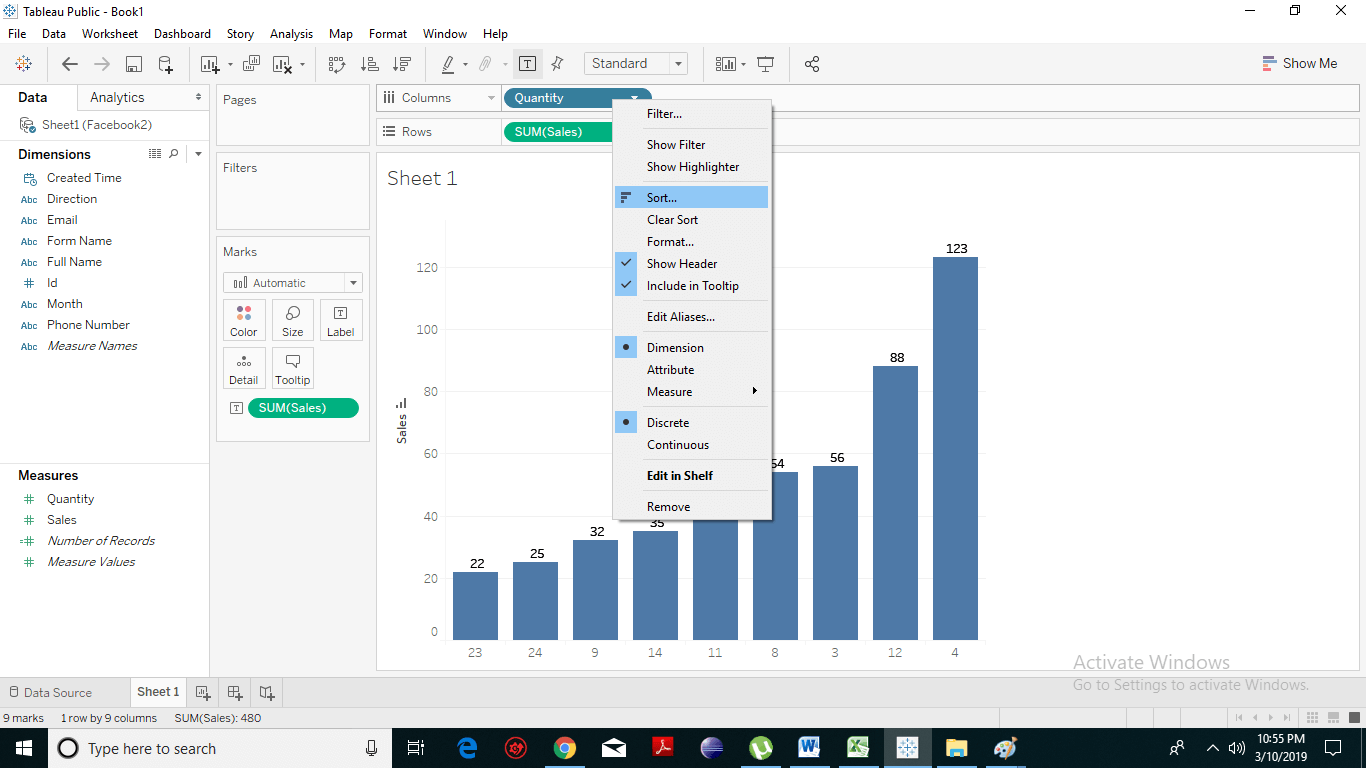
So we could sort by descending or ascending or by sales or alphabetic. You can also choose the field, or even you can manually change your sorting here.
In this tutorial, we’ve had an overview of how tableau works with dimension and measures.