UML Diagrams
UML Diagrams
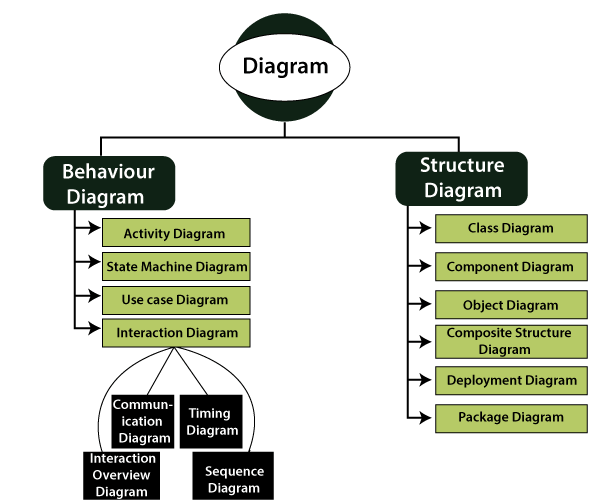
UML diagrams are classified into structural, behavioral, and interaction diagrams. The hierarchical representation is drawn as follows:
- Structural Diagrams: The static aspects of the structural diagram serve those sections of a diagram, that makes the main structure and are thus stable. It depicts several objects occupying in the system.
It demonstrates the static view of a system by describing the infrastructure or layout of a system. These diagrams focus more on composite diagrams, object diagrams, component diagrams, class diagrams, deployment diagrams, and package diagrams. Structure diagrams accentuate the things that must be available in the system being modeled. For example, these diagrams labels that the software system is scattered into elements and highlights the dependencies between these components.
Here are some structural diagrams enlisted below:
- Class diagrams: UML class diagrams are the unique constituent of every object-oriented design. UML is standardized in class diagrams. As we know, classes are the backbone of an application that is based on OOPs. Hence, the class diagram has an appropriate structure to represent the inheritance, relationships, classes, and all other aspects that OOPs have in their background. Various objects and the relationship between these objects are described in this diagram. The class diagram can be used to present the interfaces, relationships, classes, collaborations, associations.
- Composite structure diagrams: Composite structure diagram is new merchandise added combined to UML 2.0. It encompasses interfaces, classes, packages, and relationships. It also gives a logical view of everything or a unit of a software system. The word "structure" is determined in UML as a configuration of interconnected components, representing runtime occurrences collaborating on communicating links to attain a few common objectives. A composite structure is a compilation of interrelated elements that work at runtime to obtain some specific purpose. We can also design collaboration uses and collaborations together in composite structure diagrams.
- Object diagram:Object diagrams are taken from class diagrams, so object diagrams are dependent on class diagrams. Object diagrams produce the instance of the class diagram. The key concepts are similar to the object diagram and class diagram. Object diagrams depict the static view of a system, but it is a print of the system at the moment. These diagrams are used to produce a subset of objects and also their relationships at certain cite.
It defines the static behavior of the system at the specific point of time. It is applied to check the veracity of the class diagrams. It represents relationships among the classes and also depicts different instances of these classes at a time.
- Component diagram:These kinds of diagrams can be used to model the physical form of the system. Physical aspects are elements like files, libraries, documents, executables, etc. These UML diagrams are applied for designing broad systems into narrow subsystems, so that it can be quickly or easily handled. Component diagrams are used to anticipate the management and relationships between elements in a system.
Component diagrams are necessarily the class diagrams that emphasis on components of a system that often recycled to build system’s static implementation outlook. A UML component can consist of various physical productions when they spontaneously belong together. A component diagram grants for the verification that a required functionality of the system is acceptable.
- Deployment diagram: The deployment diagram is defined as a kind of layout, which illustrates the physical hardware on which the software system will be accomplished. This diagram can be a combination of nodes and their relationships and also used in modeling the physical form of an OO design. It is integrated when the software is expanded, applied, or dispersed over multiple machines with antithetical configuration.
It can describe the structure either at the specification level or at the instance level. This diagram is made up of specific UML shape patterns. A three-dimensional box is called nodes. It will be helpful to show either the underlying software or the hardware components, and nodes in the system.
- Package Diagram:A package is an organization of model elements, which means that a package can consist of model elements of different types, including some other packages to constitute hierarchies. A package specifies a namespace for its contents using for various ambitions. When applied to define package diagrams, class elements, it gives a visualization of the namespaces. The most prevalent use for package diagrams is to organize class diagrams and use case diagrams, although the use of these diagrams is not bounded to these UML elements. Thus, nodes, components, node instances, objects, use cases all can be formulated as packages. It thus enables a manageable organization of the countess elements that a UML model necessitates.
- Behavioral Diagrams: It emphasizes the dynamic behavior of a system. Dynamic behavior can be depicted as a series of diversity or changes to the system over time. It negotiates with dynamic components of a system. These diagrams include state machine diagrams, activity diagrams, and use case diagrams. It describes how the various objects collaborate with others to establish a working system. For example, an activity diagram explains the operational and business actions of the elements within a systemstep-by-step.
The behavioral diagram shows the following diagrams:
- State machine diagram:The nature of a commodity is not only a direct consequence of its inputs, but it also bet on its former state. A state machine diagram can better model the previous history of an individual. It is also called automata, traditionally. It renders the behavior of the system utilizing the finite state transition. The state machine diagram is a kind of diagram in the UML that shows transitions among the objects. It can also be used to display the usage of the protocol as a part of the system.
- Activity diagram:An activity diagram can be used to portray the control flow of the system and assign these flow steps embroiled in the implementation of the use case. It concentrates on the performance and behavior of a system rather than implementation. It is also known as an object-oriented flowchart. That’s why this diagram is an advanced version of a flow chart illustrating the flow from an activity to another activity. In this type of diagram, several activities can be concurrent and sequential. The activity diagram will have an initial state and a final state in both of these cases.
- Use case diagram: The UML 2.0 to 2.4 also specifies the use case diagram as a specification of a class diagram, which is a structure diagram. Use case models what the system requires to perform. Once the use case specified, it can be represented both visual and textual representation. The end user’s perspective plays an important role here, i.e., it helps us to design a system from the user’s point of view. It broadly utilizes use cases and actors. It renders system’s use case view. This diagram can also visualize as a set of functions, actions, and services that a system requires to perform.
- Interaction Diagrams: It interprets the interaction among two objects and the data flow between these objects. An interaction diagram is a subdivision of behavioral type of diagrams.Messages and lifelines are the two most essential components in this diagram. These diagrams are yield by UML to enact the communication between objects. It does not handle the information related to the particular communication path. Information passing is one of the most critical concerns of the interaction diagram.
Several interaction diagrams are as follows:
- Sequence diagram:A sequence diagram illustrates the interaction among several objects. We can also apply the terminology event scenarios or event diagrams to assign to any sequence diagram. Software developers use these diagrams at a higher rate. These are time focused and display the order of the interaction by using the vertical axis of the diagram. A sequence diagram is correlated with the use case recognition within the system’s logical view under development.
- Communication diagram:It is another kind of interaction diagram, which is an expansion of the object diagram. A communication diagram shows how the objects send information to each other. It also depicts the dynamic and static behavior of the system. This is where these diagram fall in and provide a broad angle in the process. The communication diagram shows a consolidation of information that is taken from class diagrams, sequence diagrams, and use case diagrams. Sequence diagrams are quite similar to this diagram because it provides the same information as sequence diagrams.
- Timing diagram:A timing diagram mainly focuses on timing constraints. Time passes from left to right on the x-axis, with the distinct system’s components that interact with each other over the y-axis. A timing diagram is used to scrutinize the behavior of objects throughout a specific time. The timing diagram is an advanced version of the sequence diagram. The difference between the both is that axes are reversed that’s why the time upturns from left axes to right axes, and lifelines are displayed in isolated compartments organized vertically.
- Interaction overview diagram:The interaction overview diagram emphasis on the critique of the flow overview of the interactions control that can also appear the activity flow among diagrams. It can also use to display the sequence of actions to reduce the complicated interactions into elementary interactions. An interaction overview diagram facilitates a high level of abstraction. Messages and Lifelines are not show at the overview level. This diagram is a mode of an activity diagram where the various nodes can serve the interaction diagram. Most of these diagram’s notations are quite similar. Forexample, decision, initial, decision, fork, merge, join, and final nodes are the same.