VBA Pivot Table Grouping
VBA- Pivot Table Grouping
For an instance, if in our pivot table, we have 11 different age groups from 20 to 30 - but there might be a possibility that we had 30 different age groups say from 20 to 50 – this will effectively increase the size of the pivot table and will make it difficult for us to make any inference from the data. Pivot Tables have a very helpful feature known as Grouping, where buckets can be created, and data can be shown for those buckets rather than each age/item.
The grouping method is used for numeric values and dates.
- Grouping Date Values by Group Method
- Grouping Date values By Weeks/ Months/ Year
- Grouping numeric Items by Group Method
In the below excel sheet, we can observe that the date values in the first column. We can modify the date values by grouping them together based on the year. Individual dates are making the sheet size bigger thus, decreasing the readability and increasing the time.
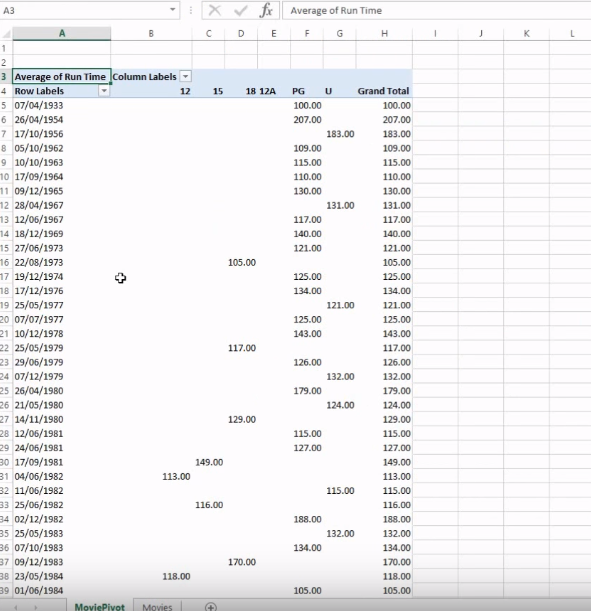
The only solution to the above problem is grouping. If we group the dates based on its year, the sheet will become shorter. So, you can do this manually by right-clicking on the date cell and choosing a group. You will get a dialog box provided with a range of different options to group your data. So, it allows you to select a start date and an end date and then an increment of time or multiple increments.
We can achieve the same result through VBA as well by writing a few lines of code.
Program:
Sub PivotTable_Grouping()
Dim r As Range
Dim ws As Worksheet
Dim PT As PivotTable
'setting the worksheet
Set ws = Worksheets("Pivot")
Set PT = ws.PivotTables("Pivot")
'set range of dates to be grouped
Set r = PT.RowRange.Cells(2, 1)
r.Group _
    Start:=True, End:=True, _
    Periods:=Array(False, False, False, False, False, False)
End Sub
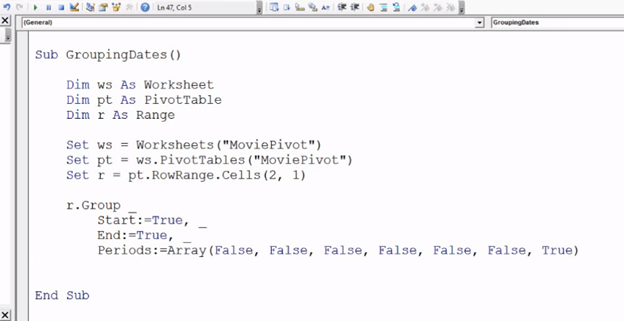
Explanation: Firstly, we will create a worksheet, and we will refer to the worksheet to the Excel sheet. Then we will declare our Pivot table and refer it as well wit the worksheet. We will give set a reference to the date value by Range variable and will refer it to a Row range for Cells (2,1). It will select the complete row range values. Now, the task left is to group as per year. So we will fill the values including start as True, End as True and in Periods (we can group by different units and increments of time) we will pass an array of seven Boolean values (True/False) that indicate whether or not I’m grouping by that particular increment of time. The last array refers to Years so we will set six FALSE followed by a True.
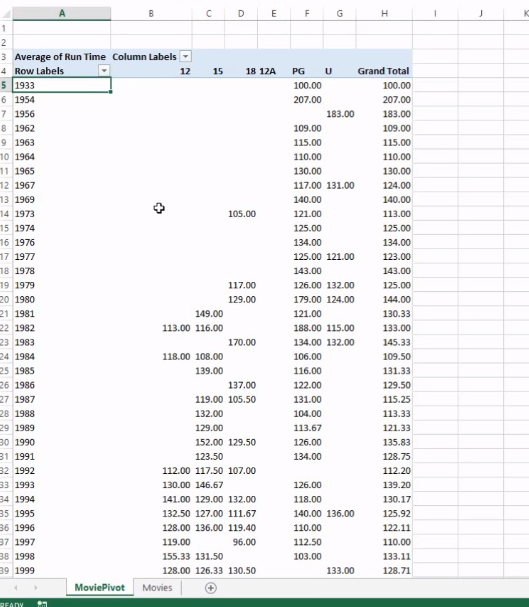
Output:
In the below sheet, you will find the dates have been grouped by year and it has become much shorter.