Data Science Tutorial
Data Science is the most challenging field of the 21st generation. Every type of IT industry is looking for candidates with knowledge of data science. We are providing the basic and some advanced concepts related to the operation that can be performed upon the data with the help of different technologies.
In this tutorial, we will discuss the following topics:
- What is Data Science
- The need for Data Science
- Jobs in Data Science
- Types of Jobs in Data Science
- Prerequisites of Data Science
- Components of Data Science
- Tools of Data Science
- Work Flow of Data Science
- Life Cycle of Data Science
- BI (Business Intelligence) Vs. Data Science
- Applications of Data Science
- Data Science Vs. Big Data
- Conclusion
What is Data Science?
Data Science is the multi corrective field that uses scientific methods, processes, algorithms, and systems to extract the knowledge and insights from the ordered and shapeless data. It is the future of artificial intelligence.
Data Science is a deep study of a massive amount of data that is involved in extracting meaningful observations from raw, structured, and unstructured data, which is processed by using the scientific methods, different technologies, and algorithms. It is the same concept as per the data mining and big data.
Data Science is the "concept to unify the statistics, data analysis, machine learning, and their related methods" in order to understand and analyze the original phenomena related to data. It is crucial for better marketing. Most companies use the data to analyze their marketing strategies and make a better advertisement.
The main purpose of data science is to find the patterns within the data and uses several techniques to analyze and draw the perceptions from data. In Data Science, the data scientist has the responsibility of making the predictions from the data. So, a data scientist aims to derive the conclusions from the whole data. With the help of these conclusions, the data scientist can support the industries in making smarter business decisions.
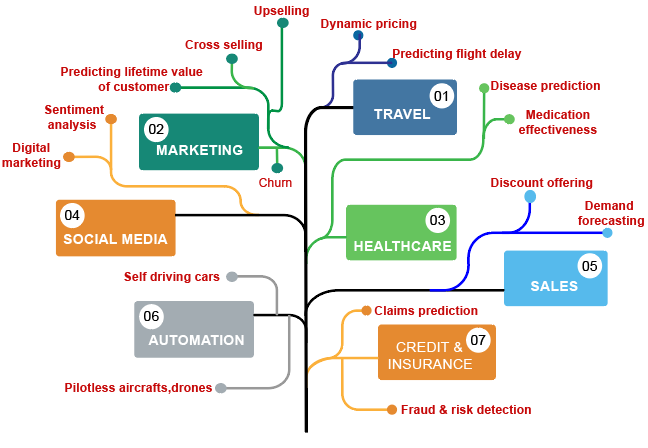
Figure: Use cases of Data Science.
Example- Getting the ride from Uber is easy, how
Simply, the user can open the application and set his pickup point and drop location, and then the cab is booked. If anyone has booked the taxi through Uber or Ola, the user can get the expected price and time to cover the specific distance.
How are these apps capable of showing all the information? The answer to this is the concept of Data Science. The predictive analysis in Data Science is helping Uber to show the user, pickup point, drop location, and the arriving time.
Data Science uses powerful hardware, programming systems, and efficient algorithms to solve data-related problems.
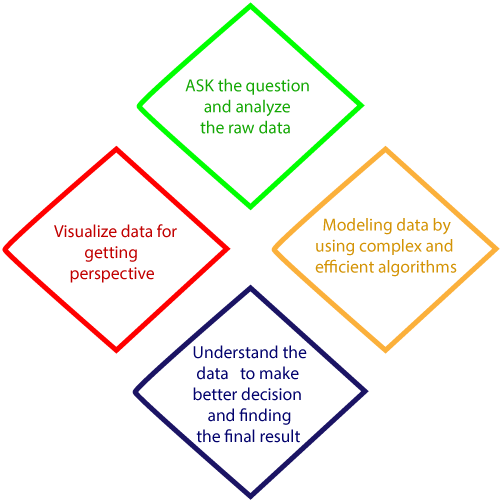
In short, we can define the Data Science is all about:
- Ask correct questions and analyzing the raw data
- Visualize data for getting a better perspective.
- We are modeling the data by using various complex and efficient algorithms.
- Understand the data to make a better decision and finding the final result.
The need for Data science
A few years ago, we didn't have a large amount of data, and data was available in the structured form, which could be stored in the excel sheets and processed by using simple Business Intelligence tools.
But, now the data has become vast. So, we have a lot of data to be processed, approximately 2.5 quintals bytes of data generating per day. There are some points related to the need for Data Science that is given below:
- IT Industries needs data to help them and make careful decisions. Data Science is a piece of raw data into meaningful observations.
- All the Industries require Data Science for handling the large volume of data, and this thing increases its importance.
- Data Science is used by almost every type of industry, but some major sectors are healthcare, finance, Banks, business, startups, etc.
- Data Science is a career for the future. Every industry is becoming data-driven, and innovations are being made every day.
- The industry requires a data scientist to support them in making smarter decisions. Everyone needs data scientists to predict the information.
- Data Science is very important for better marketing. The industries are using data to analyze their marketing strategies and generate improved advertisements. The Decisions can be made by analyzing the customer’s feedback; therefore, industries are using data science to run a particular campaign.
- Data Science is also working for automated transportation, such as creating a self-driving car, which is the becoming future of transportation.
Every company needs data to work, grow, and for improvement of their business. In Data Science, Handling such a vast amount of data is a challenging task for every organization. We need some complex, powerful, and efficient algorithms to handle, process, and analyze the data.
Jobs in Data Science
According to different surveys, the Data Scientist profile is the most trending job these days due to the increasing demand for Data Science. So, it is also known as the “hottest job title “nowadays.
The Data Scientists are those experts who can use several statistical tools and machine learning algorithms to understand and analyze the data related to the particular organization. The average salary of data scientists is in between $95,000 to $165000 per annum as per the survey.
Types of jobs in Data Sciences
If anyone learns data science, then, he gets the opportunity to find several exciting job roles in that domain. Some main job roles are given below:
1. Data Scientist
2. Data Analyst
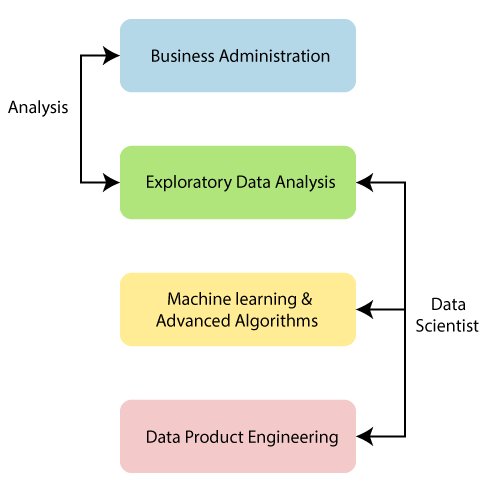
Figure: Data Scientist vs. Data Analyst.
3. Data Architect
4. Data engineer
5. Machine Learning expert
6. Data Administrator
7. Business Analyst
8. Business Intelligence Manager
9. Data Science Generalist
10. Application Architect
11. Infrastructure Architect
12. Enterprise Architect
13. Statistician
Prerequisites of Data Science
Data Science is a vast field that is based on several areas. It is the hottest carrier of the 21st Century. There is an infinite amount of data or information that can be stored, interpreted, and applied for a wide range of purposes. The prerequisite of Data Science is divided into two categories which are given below:
Technical Prerequisites
Many technical skills are required to be a Data Scientist, which are given below:
1. R programming
Any individual needs the depth knowledge of at least one analytical tool like R programming, which is preferred for Data Science. This R programming language is specially designed for Data Science.
We can use the R programming language to solve any problem encountered in Data Science. In fact, 46% of Data scientists are using the R programming language to solve the statistical issues. The R programming language has a steep learning curve.
2. Python language
Python is the most common programming language. It has an essential role in data science along with Java, Perl, C/C++, etc. This programming language is very helpful to the data scientist. The Python is used in data science because of its versatility; we can use it for almost all the steps which are involved in Data Science processes. The python can takes several formats of data, and we can easily import the SQL tables into our codes. It allows the user to create datasets, and the user can find any Data set according to his need on Google.
3. Hadoop Platform
The Hadoop platform is not always required in data science, and this is heavily preferred in some cases. The knowledge and experience of Hive or Pig are the extra points to use the Hadoop platform.
It is also familiar with cloud tools such as Amazon S3, which is very beneficial for data science. As a data scientist, we may encounter a situation where the volume of data we have exceeds the memory of our system, or we need to send the data to the different servers.
We can use the Hadoop to convey data to several points on the system quickly. We can use it for data exploration, data filtration, data sampling, and summarization.
4. SQL Database/ Coding
NoSQL and Hadoop have become a large element of data science. The SQL is the programming language that can help us to carry out the operations like add, delete, and extract data from the database.
It is still expected that the candidate can write and execute the complex queries in SQL. The SQL Database also helps the user to carry out the analytical functions and transform the database structures.
The SQL database is specially designed to help the user to access, communicate, and work on the data. The user needs to be proficient as a data scientist. It gives the user insights when the user uses it for the query in the database.
The SQL database has concise commands which can help the user to save the time and less amount of programming the user needs to perform complicated queries. The learning of SQL will help the user for a better understanding of relational databases and boost the user's profile as the data scientist.
5. Apache Spark
Apache Spark is becoming the worldwide most popular big data technology. It is a big data computational framework, like Hadoop. The Spark is faster than the Hadoop.
The Hadoop reads and writes to the disk, which makes it slower, but the Spark caches its computations in memory. The Apache spark is specially designed for data science to run its complicated algorithms faster. It also helps in disseminating data processing when we are dealing with a large amount of data to save time.
The Apache sparks are also helping the data scientist to handle the complex unstructured data sets. We can use Apache Spark on one machine or cluster of machines. The Data Scientist can prevent the loss of data with the help of Apache Spark in Data Science.
The Speed of the Apache Spark is its Strength. The user can carry out the analytics from data intake to distributed computing with the help of Apache Spark.
6. Machine Learning and Artificial Intelligence
There is a large number of Data Scientists who are not proficient in machine learning areas and techniques. The machine learning has several fields, such as neural networks, reinforcement learning, adversarial learning, supervised machine learning, decision trees, logistic regression, etc.
These machine learning technical skills will help the user to solve different types of Data Science problems, which are based on the predictions of major organizational outcomes. Data Science is always involved working with a large number of data sets so, the user may want to be familiar with machine learning.
7. Data Visualization
The world of business produces a large amount of data frequently. This produced data needs to be translated into a format that will be easy to comprehend. The people can understand pictures in the forms of charts and graphs more than raw data. There is an idiom “A picture is worth a thousand words” so, we should prefer the graphical representation.
The Data Scientist must be able to visualize the data by the aid of data visualization tools such as ggplot, d3.js, Matplottlib, and Tableau, etc. These data visualization tools will help the user to convert the complex results of projects into that format, which can easily comprehend. Data visualization provides the opportunity to work with the data directly.
8. Unstructured Data
It is very critical that Data Science can work with unstructured data. This type of data defines that content which does not fit into the database tables. The unstructured data includes videos, blog posts, customer reviews, social media posts, video feeds, audio, etc. The sorting of these data is not easy because unstructured data is not streamlined.
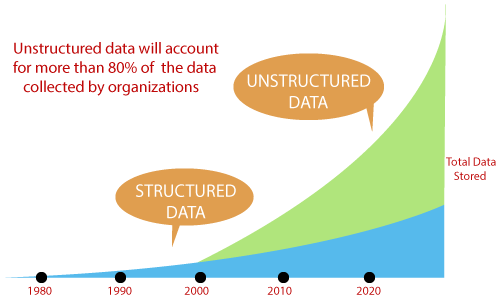
Figure: Flow of the unstructured data.
Most of the people refer to unstructured data as the “dark analytics” because of its low complexity. As a Data Scientist, the user has the ability to understand and manipulate unstructured data from different platforms.
Non-Technical Prerequisites
1. Intellectual Curiosity
Albert Einstein says that “I have no special talent. I am only passionately curious.” Curiosity can be defined as a desire to acquire more knowledge. If the users have curiosity, then, user can ask more and more questions about the data. Because the data scientists spend 80 percent of the time in discovering and preparing the data.
2. Teamwork
The Data Scientist cannot work alone. He will have to work with the company executives to develop the strategies, work with product managers and designers to make better products. Data scientists will have to work with the marketers to launch the better-converting campaigns, work with the client, and server software developers to create the data pipelines, and improve workflow.
3. Communication skills
Every industry needs an active data scientist who is looking for someone who can translate his technical findings clearly and fluently to the non-technical team, such as marketing or sales departments.
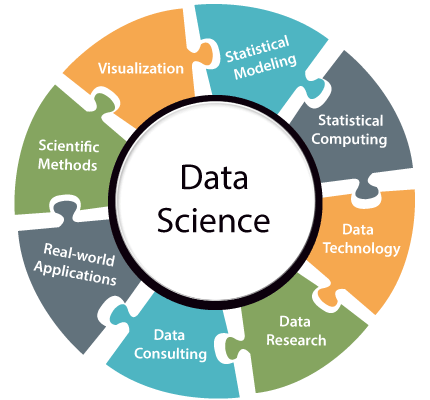
Components of Data Science
There are various types of components exist in Data Science which is given below:
Organizing the data
Organizing the data is the way of planning and execution of the physical storage. The structure of data takes place after applying the best practices of data handling.
Packaging the data
The packaging of data means the creation of prototypes, statistics is applied, and the Visualization is developed. It is related logically as well as aesthetically modifying and combining the data in the presentable form.
Deliver the data
The Delivery of data is related to that story, which is narrated, and value is received after the process. This delivers data to make sure that the final output has been delivered to the concerned person.
Data Analysis
The Data analysis is like quizzical activity. It is the process of inspecting, transforming, and modeling the data with the discovering of useful information or data.
Data integration is the precursor of Data analysis, and it is closely linked to data visualization and data dissemination. The data analysis breaks out the macro picture of data into the micro image. It helps the user to identify new or unusual patterns and grasp difficult concepts.
Data Analytics
Data Analytics is the technique of data analysis. It can examine the data sets and concludes the information. Data analytics is used widely in the commercial industry.
Data Mining
Data mining is a process that helps the industries in turning their raw data into a useful and informative form. It can increase profitability. Data Mining is an advanced type of data analytics.
It uses that type of software which looks for the patterns in the large batches of data. The data mining helps users to enhance the quality of customer relations with the help of ensuring and giving the best quality of products.
Big Data
Big Data referred to the massive, high-volume, structured, or unstructured data. It is the processing that enables enhanced insight, decision making, and process automation. Big data is an asset for organizations. It can control the online reputation via the tools which can do sentimental analysis.
Machine Learning
Machine Learning is a subdivision of artificial intelligence or an application. It is used in multi-dimensional and multi-variety of data, which is compatible in the dynamic environments. Machine learning simplifies the Time-Intensive Documentation by using the data entry.
Statistics
The statistics are a vast field of data science. It is a way to analyze numerical data. It is used to find meaningful insights from the numerical data.
Domain Expertise
The domain expertise combines data science together. It is related to the specialized knowledge or skills of a particular field. There are several fields in data science for which we require domain expertise.
Data Engineering
Data Engineering is a data science aspect that focuses on the practical applications of data collection and analysis.
Visualization
The data visualization refers to the techniques which are used to communicate the data or information by encoding it as the visual objects contained in the graphics. It includes the graphs, charts, mind maps, infographics, and other and other visuals to help convey key data.
Advanced computing
Advanced computing is the heavy lifting of data science. It is related to the designing, writing, debugging, and maintaining the source code of the computer programs.
Mathematics
Mathematics is a very critical part of data science. It is related to the study of quantity, structure, space, and changes. The good knowledge of mathematics is essential for data scientists.
Tools of Data Science
The Data scientist is responsible for extracting, manipulating, pre-processing, and generate the predictions out of data. So, they require statistical tools and programming languages. These tools are used by the data scientist to carry out their data operations.
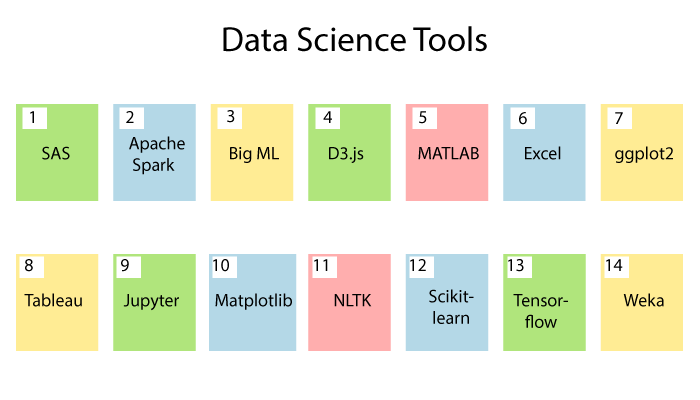
There are various types of data science tools which are given below:
1. SAS (Statistical Analysis Software)
The SAS (Statistical Analysis Software) is one of those data science tools which are specially designed for statistical operations. It is the closed source proprietary software that is used by large organizations to analyze the data.
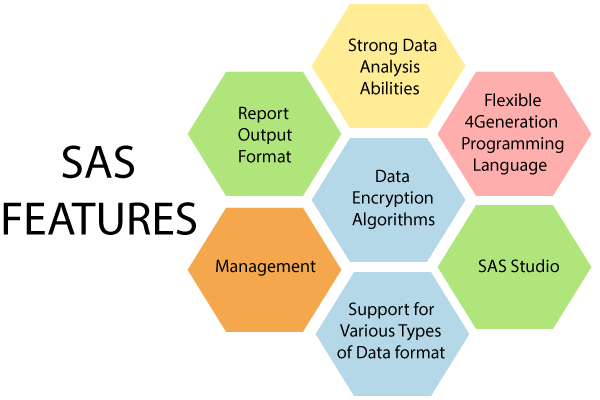
This software uses base SAS (Statistical Analysis Software) programming language to perform statistical modeling. Professionals widely use SAS, and the industries are working on reliable commercial software.
2. Apache Spark
The Apache Spark is the powerful analytics engine and the most useful tool of data science. It is specially designed to handle batch processing and stream processing. The Apache spark has many APIs which facilitate the data scientists to create the repeated access of data for machine learning.
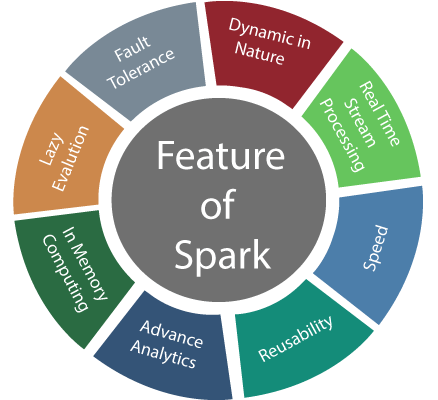
Apache Spark is the improvement over Hadoop and able to perform 100 times faster than Map Reduce. It has several machine learning APIs which can help the data scientist to create powerful predictions with the given data.
This software does better than other Big Data platforms in its ability to handle the streaming data. It means this tool can process real-time data as compared to other analytical tools that process only historical data in batches.
3. BigML
The BigML is another widely used Data Science tool. This tool is to provide a fully interactable, cloud-based GUI environment that can be used by the user for processing the machine learning algorithms. It also provides standardized software by using cloud computing for industry requirements.
It can provide the easy use of web-interface by using the Rest APIs, and the user can create a free account or premium account based on the user's need. This BigML tool allows interactive visualizations of data and provides the user with the ability to export the visual charts on the user's mobile or IoT devices.
4. D3.js
JavaScript is mainly used for the client-side scripting language. The D3.js is the library of JavaScript, which allows the user to make interactive visualizations on the web browser. The user can use different functions to make the dynamic visualizations on the web browser via several APIs of D3.js.
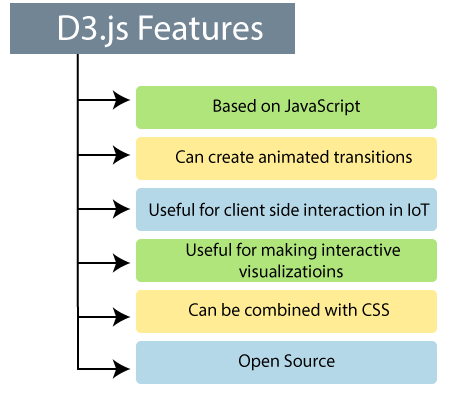
The usage of animated transitions is a powerful feature of D3.js, and it makes documents dynamic by allowing them to update on the client-side. It is also using actively change in data to reflect the visualizations on the browser.
The user can combine the D3.js with CSS to create illustrious and brief visualizations that will help the user to implement the customized graphs on the web-pages. It is a very useful tool for the Data Scientists who are working on the IoT based devices, which requires client-side interaction for the Visualization and the data processing.
5. MATLAB
The MATLAB is the multi-paradigm numerical computing environment for the processing of mathematical information. It is the closed-source software that facilitates matrix functions, algorithmic implementation, and statistical modeling of data. It is most widely used in several scientific disciplines.
It is mainly used for simulating neural networks and fuzzy logic in data science. The user can create powerful visualizations by using the MATLAB graphics library. It is also used in image and signal processing, which makes it very versatile for data scientists.
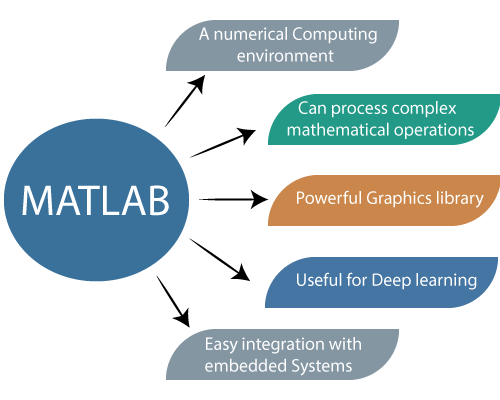
MATLAB is an ideal data science tool because of its easy integration for enterprise applications and embedded systems. It also helps in automating several tasks ranging from the extraction of data to the re-use of scripts for decision making.
6. Excel
Microsoft developed Excel for the spreadsheet calculations, but nowadays, it is widely used for data processing, Visualization, and complex calculations. It is the most powerful analytical tool for data science.
Excel comes with different formulae, tables, filters, slicers, etc. The user can also make their custom functions and formulae by using excel. It is not used for calculating the huge amount of data. Still, it is an ideal choice for creating powerful data visualizations and spreadsheets.
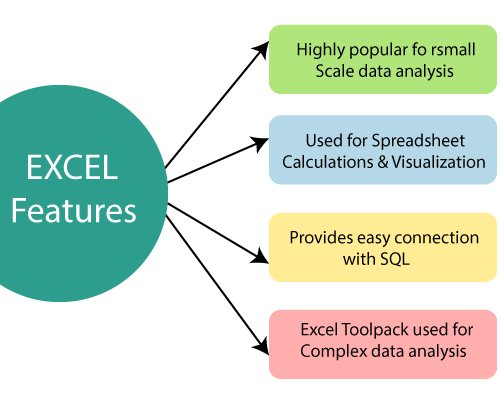
The user can also connect the SQL with this excel tool and use it to manipulate and analyze the data. There are a lot of scientists who use excel for the data cleaning as it provides interact able GUI (graphical user interface) environment to the pre-process information easily.
7. ggplot2
The ggplot2 is an advanced data visualization package for the R programming language. Developers mainly created this gglpot2 tool to replace the native graphics package of R programming language. It is the most widely used library which is used by the data scientist for creating the visualizations from analyzed data. This tool uses powerful commands to create illustrious visualizations.
This tool is part of the tidy verse, which is the package of the R programming language and designed for data science. Data Scientists can create customized visualizations to engage in enhanced storytelling with the help of ggplot2.
8. Tableau
Tableau is the data visualization software that is packed with powerful graphics to create interactive visualizations. It is used in those types of industries that are working in the field of business intelligence. It has the ability to interface with the databases, spreadsheets, OLAP (Online Analytical Processing) cubes, etc. It can also visualize the geographical data and plotting the longitudes and latitudes on the maps.
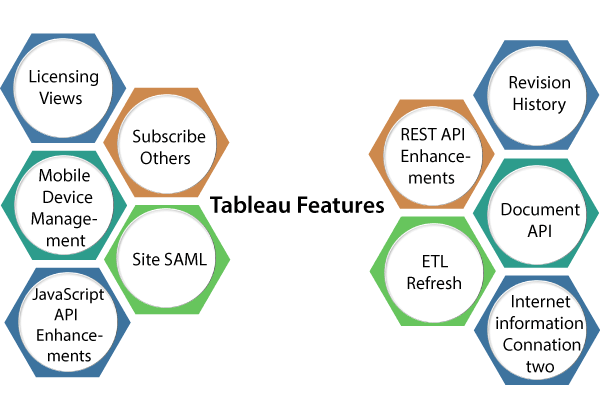
Along with the visualizations, the user can also use its analytics tool to analyze the data. Tableau is enterprise software that comes with the free version, called Tableau public.
9. Jupyter
The Jupyter is an open-source tool that is based on the Python language for the help of developers in making the open-source software and experiences in interactive computing. Jupyter supports multiple languages such as Julia, Python, and R programming.
This tool is a web application tool that is used for the writing of live code, visualizations, and presentations. It is a worldwide popular tool and is designed to address the requirements of data science. There is an online Jupyter environment known as the Collaborator, which runs on the cloud and stores data in Google Drive.
The Jupyter is an interactive environment through which the data scientists can perform all the responsibilities. Different types of presentation features are available in this tool. Anyone can perform various tasks such as data cleaning, statistical computation, Visualization, and create predictive machine learning models by using the Jupyter notebook.
10. Matplotlib
The Matplotlib is the plotting and visualization library which is developed in Python programming language. This tool is mainly used for the plotting complex graphs by using simple lines of code. Anyone can generate bar plots, histograms, scatter plots, etc. It has several essential modules. Pyplot is one of the most widely used modules.
The Matplotlib offers MATLAB like an interface. It is also an open-source alternative to MATLAB's graphics modules. It is the preferred tool for the data visualizations and used by the Data Scientists over the contemporary tool.
NASA is also used the Matplotlib for illustrating data visualizations during the landing of spacecraft. This tool is also an ideal tool for beginners to learn data visualization with Python.
11. NLTK (Natural Language Toolkit)
Natural Language processing has developed as the most popular area of data science. Natural Language Processing is related to the development of statistical models, which helps the computers to understand human language.
This type of statistical model is part of Machine learning with the help of several algorithms. The Python language comes with the collection of libraries, which is called as Natural Language Toolkit.
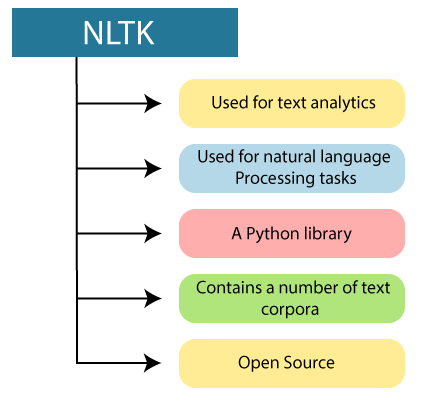
This tool is widely used for different languages processing techniques such as tokenization, stemming, tagging, parsing, and machine learning. The NLTK tool consists of over 100 corporations or groups, which are the collection of data for building the models of machine learning. This tool has a variety of applications such as part of speech tagging, Word Segmentation, Machine Translation, Text to Speech Recognition, etc.
12. Scikit-learn
The Scikit-learn is the library based on the Python language, which is used for implementing the machine learning algorithms. Scikit- learn is simple, easy to implement, and widely used for analysis and data science. This tool also supports a variety of features in machine learning, such as data pre-processing, classification, regression, clustering, dimensionality reduction, etc.
This tool can use different underlying Libraries of Python language such as Scipy, Numpy, and Metplotlib, etc. Scikit- learn tool makes it easy to use the complex machine learning algorithms.
13. Tensor Flow
The Tensor Flow has become a standard tool for Machine Learning, which is used for advanced machine learning algorithms such as Deep Learning. Developers named it as Tensor Flow because Tensors are used in it, which are multi-dimensional arrays. This tool is an open-source and ever-evolving tool kit that is known for its high performance and computational abilities.
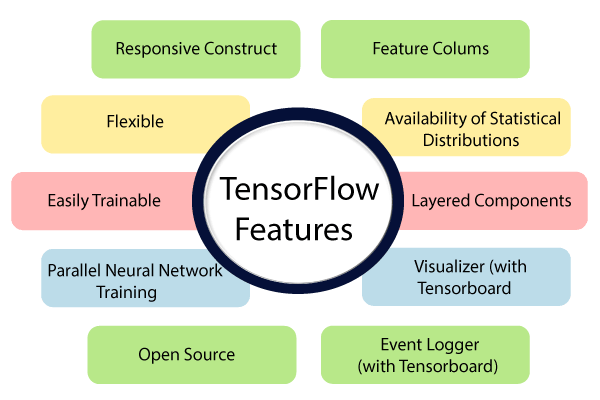
This tool can run on both CPUs and GPUs. It has recently emerged on the more powerful TPU platforms. These platforms give it an unprecedented edge in terms of the processing power of advanced machine learning algorithms.
Due to the Tensor Flow’s high processing ability, it has a variety of applications such as speech recognition, image classification, drug discovery, image and language generation, etc.
14. Weka
The Weka tool is the environment for knowledge Analysis machine learning software, which is written in Java. It is the collection of several machine learning algorithms for data mining. It consists of different machine learning tools such as classification, clustering, regression, Visualization, and data preparation.
This tool is open-source GUI software, which allows easier implementation of machine learning algorithms through interacting able platform. The user can understand the functioning of machine learning on the data without having to write a line of code. The Weka is the ideal for the Data Scientists who are the beginners in machine learning.
Work Flow of Data Science
There are various steps in the workflow of data science. It is said that many data scientists spend 80% of their time cleaning the data, and only 20% of the time gives to analyze the data. The order of workflow in data science is given below in the diagram:
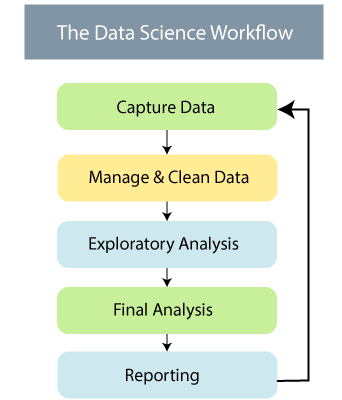
The data is everywhere; 2.5 billion gigabytes of data were generated every day in 2012. The data cleansing, preparation, and analysis are three main parts of the workflow in data science.
Life Cycle of Data Science
The life cycle of data science is related to jumping back and independent data science tasks by using a variety of data science programming tools. The data science projects do not have the nice clean lifecycle with well-defined steps like the software development life cycle.
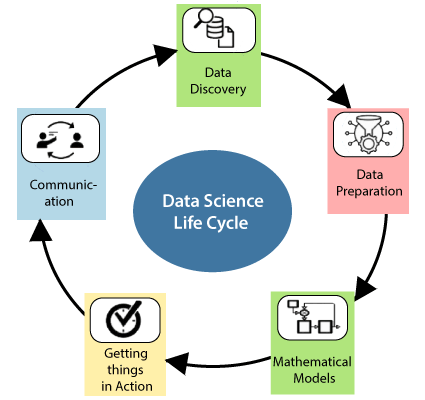
There are various steps in the life cycle of data science which are given below:
1. Data Discovery
The first phase of the data science life cycle is data discovery, which is related to ask the right questions. If we start any data science project, then we need to fix the basic requirements, priorities, and project budget.
2. Data Preparation
Data Preparation is the second phase of the data science life cycle. We need to perform various tasks which are given below:
- Cleaning of data
- Reduction of data
- Integration of data
- Transformation of data
After performing all the above steps, we can easily use the data for further processing.
3. Mathematical Models
The model building process is started in this phase of the data science life cycle. We need data sets for training and testing purposes. There are several techniques to build the model in data science, such as association, classification, and clustering, etc.
There are some common tools to build models in data science, which are given below:
- MATLAB
- WEKA
- SAS Enterprise Miner
- SPCS Modeler
4. Getting the things in action
In this phase of the life cycle, we will deliver the final reports of the whole project with the brief code and technical documents. This phase provides the user with a perfect overview of the entire project. The user can check the performance and many other components on a small scale before the full deployment of the project.
5. Communication
In the communication phase, we will check if we reach the goal or aim. That goal is decided in the initial phase of the life cycle. After finding the final results, we can communicate with the business team of the company.
BI (Business Intelligence) Vs. Data Science
| BI (Business Intelligence) | Data Science |
| 1. Business intelligence deals with data analysis on the business platform. | 1. Data Science consists of different data operations in several domains. |
| 2. The user can analyze the past data with the help of BI. | 2. Data Scientists can analyze past data for future predictions. |
| 3. We can handle the static and structured data in BI. | 3. Structured and unstructured data is handled in data science, which is dynamic. |
| 4. The data is mostly stored in data warehouses in Business Intelligence. | 4. The data utilization is distributed in real-time clusters in data science. |
| 5. The BI help different industries to the various questions related to the business. | 5. The data scientist solves several types of questions in data science. |
| 6. The MS Excel, SAS BI Science, Microstrategy are the various tools of Business Intelligence | 6. Python, R programming language, Hadoop, Spark, SAS. Tensor Flow is an important tool for data science. |
| 7. There are only two skills required for business intelligence, statistics, and Visualization. | 7. Several skills required in data science such as machine learning, Python Language, statistics, Visualization, etc. |
Applications of Data Science
There are various applications of data science which are given below:
- Fraud And Risk Detection
- Internet searching
- Healthcare
- Targeted advertise
- Website Recommendations
- High Image Recognition
- Airline Route Planning
- The Speech Recognition
- Game Applications
- Augmented reality
Data Science vs. Big Data
| Data Science | Big Data |
| 1. Data Science provides methods or techniques to analyze the data. | 1. Big Data is categorized with its velocity, variety, and volume. |
| 2. Data Science means the data focused on scientific activity. | 2. Big Data means the huge volumes of data that cannot be handled by using traditional database programming. |
| 3. In data science, the specialized fields involving scientific programming tools, models and techniques to process the big data | 3. Diverse data types generated from the multiple data sources in big data. |
| 4. The data science is involved in the extensive use of mathematics, statistics, and other tools. | 4. Big data is mainly used to develop business agility and gain competitiveness. |
| 5. Data Science is used to understand the patterns within the data and make decisions. | 5. The use of Big Data is to process huge volumes of data and generate insights. |
Conclusion
At the end of this Data Science tutorial, we can say that the main purpose of Data Science is extracted, pre-process, and analyze the data. The Data Scientists are the backbone of data-intensive industries. The industries can make better decisions with the help of Data Science. It is a combination of analytical engineering and exploration. The business presents a problem, and we would like to solve that particular problem with the help of data science.