Introduction to SVG
Introduction to SVG
In D3.js, SVG represents Scalable Vector Graphics. SVG is a text or XML (Extensible Markup Language) based image or graphics format used to grant the options to draw various shapes like line, circle, triangle, rectangle, ellipse, etc. So, the SVG helps you to design the visualization more flexibly and effectively.
Features of SVG
Here, some important features of SVG are given below-
- Scalable Vector Graphics (SVG) can be presented as the DOM (Document Object Model).
- The structure of SVG is similar, like HTML.
- You can determine the properties of SVG as attributes.
- The SVG can be considered as a vector-based graphics or text-based format.
- The utter position of SVG should be related to origin (0,0).
- You can also involve the SVG in an HTML document.
Create a Line Element
Here, we are going to create a SVG line image and include it within the HTML document.
Step 1: First, create an SVG image that have 400-pixel height and 400-pixel width.
<svg width = “400” height = “400”></svg>
In the above code, we used the <svg> tag and height and width are the attributes of <svg> tag. By default, the SVG format takes pixel as its unit.
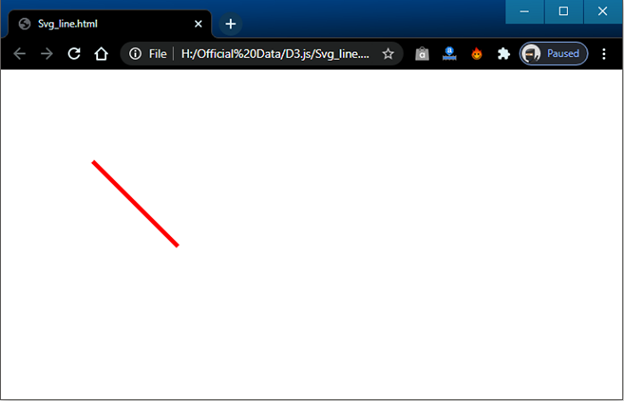
Step 2: Now, draw a line with starting points (200, 200) and the ending points (400, 200). You can set any color for the line. Here, we have set the green color for the line.
<line a1 = “200” b1 = “200” a2 = “400” b2 = “200” style = “stroke: rgb(250, 0, 0); stroke-width: 2”/>
In the above-given code, we used a <line> tag, which helps to draw a line and also contained the attributes a1, b1 as a staring point, and a2, b2 as ending points. The <style> tag is used to set the color of the line and the thickness of the line can be set by using stroke-width style attribute.
a1 – Coordinate of a for the first point
b1– Coordinate of b for the first point
a2 – Coordinate of a for the second point
b2 – Coordinate of b for the second point
stroke-width – Controls the line thickness
stroke – Controls the line color
Step 3: Now, you are required to create an HTML file named svg_line.html and attach it with the SVG code as shown in the below code.
<!DOCTYPE html>
<html>
<head>
<script type = "text/javascript" src = "https://d3js.org/d3.v4.min.js"></script>
<style>
body { font-family: Arial; }
</style>
</head>
<body>
<div id = "svgcontainer">
<svg width = "300" height = "300">
<line a1 = "100" b1 = "100"
a2 = "200" b2 = "200" style = "stroke:rgb(250,0,0);
stroke-width:5"/>
</svg>
</div>
<p></p>
<p></p>
</body>
</html>
Output
After the successful execution of the above code, you will get the following output:

SVG with D3.js
You can also generate SVG with the help of D3.js, as shown in the below steps:
Step 1: First, you need to create a svgcontainer for storing the graphics as given in the below code:
<div id  = “svgcontainer”>
</div>
Step 2: Now, you are required to choose the SVG container with the help of select() method and implant the SVG element with the help of append() method. You can also add the styles and attributes using the attr() method and style() method. It is shown as follows-
var width = 400;
var height = 400;
var svg = d3.select (“#svgcontainer”) .append(“height”, height).append(“svg”), attr(“width”, width);
Step 3: Now, you need to attach the line element within the SVG element as given in the below code:
svg.append(“line”)
.attr(“a1”, 100)
.attr(“b1”, 100)
.attr(“a2”, 200)
.attr(“b2”, 200)
.style(“stroke”, “rgb(250, 0, 0)”)
.style(“stroke-width”, 4);
Example
Here, we have discussed an example to understand the above code.
<!DOCTYPE html>
<html>
<head>
<script type = "text/javascript" src = "https://d3js.org/d3.v4.min.js"></script>
<style>
 body { font-family: Arial; }
</style>
</head>
<body>
<div id = "svgcontainer">
</div>
<script language = "javascript">
var width = 300;
var height = 300;
var svg = d3.select("#svgcontainer")
.append("svg")
.attr("width", width)
.attr("height", height);
svg.append("line")
.attr("a1", 100)
.attr("b1", 100)
.attr("a2", 200)
.attr("b2", 200)
.style("stroke", "rgb(255,0,0)")
.style("stroke-width", 4);
</script>
</body>
</html>
Output
You will get the following output, after the execution of the above code:
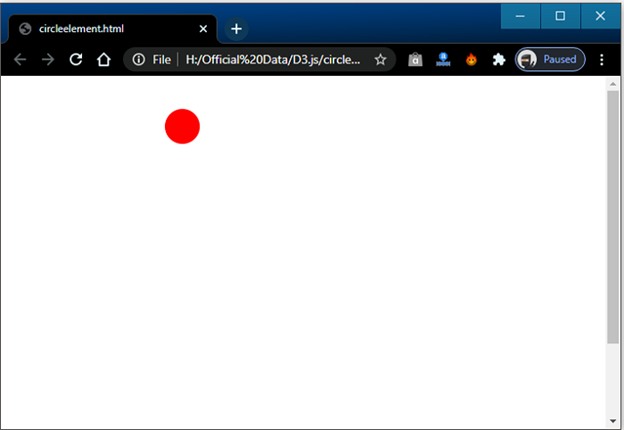
Create a Circle Element
Here, we will create a circle with the help of <circle> tag as shown in below code-
<circle cx = “200” cy = “50” r = “20”/>
The circle attributes are-
cx – coordinate of x for the center of the circle
cy – coordinate of y for the center of the circle
r – radius of the circle
Here, we have the code to draw a circle in SVG is shown below-
<svg width = “200” height = “200”>
<circle cx = “200” cy = “50” r = “20” fill = “red”/> </svg>
Example
Here, we have an example to illustrate the same:
<!DOCTYPE html>
<html>
<head>
<script type = "text/javascript" src = "https://d3js.org/d3.v4.min.js"></script>
</head>
<body>
<div id = "svgcontainer"></div>
<script>
var width = 500;
var height = 500;
var svg = d3.select("#svgcontainer")                                     //Create SVG element
 .append("svg")
 .attr("width", width)
 .attr("height", height);
svg.append("circle")                                                              //Append circle
.attr("cx", 200)
.attr("cy", 50)
.attr("r", 20)
.attr("fill", "red");
</script>
</body>
</html>
Output
After the successful execution of the above code, we will get the following output:
Create a Rectangle Element
By using <rect> tag, you can easily draw a rectangle in SVG (Scalable Vector Graphics). It is shown in below code:
<rect x = “0” y = “0” width = “400” height = “400”>
</rect>
A rectangle contains the following attributes:
x – It represents the coordinate of x for the top-left corner of the rectangle.
y – It represents the coordinate of y for the top-left corner of the rectangle.
Height – It represents the height of the rectangle.
Width – It represents the width of the rectangle.
The simple SVG rectangle can be defined as shown below-
<svg width = “400” height = “400”>
<rect x= “0” y = “0” width = “400” height = “400”>
</rect>
</svg>
Example
An example is given below to create an SVG rectangle:
<!DOCTYPE html>
<html>
<head>
<script type = "text/javascript" src = "https://d3js.org/d3.v4.min.js"></script>
</head>
<body>
<div id = "svgcontainer"></div>
<script>
var width = 400;
var height = 400;
var svg = d3.select("#svgcontainer")                                  //Create SVG element
.append("svg")
.attr("width", width)
.attr("height", height);
  svg.append("rect")                                    //Create and append rectangle element
  .attr("x", 0)
  .attr("y", 0)
  .attr("width", 300)
  .attr("height", 300)
  .attr("fill", "black");
</script>
</body>
</html>
Output
After the successful execution of the above code, you will get the following result:

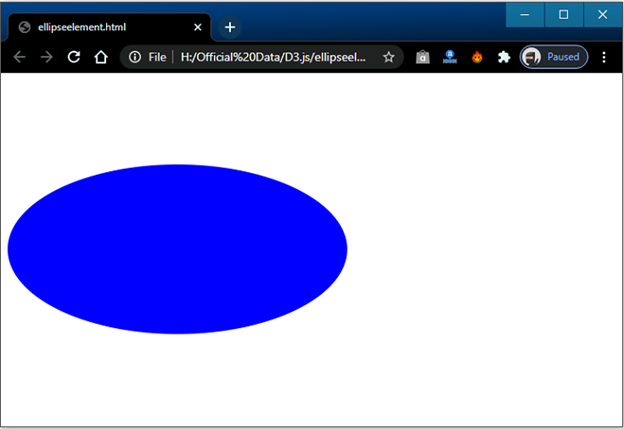
Create an Ellipse Element
Unlike the circle, an ellipse contains two radiuses (rx, ry). By using <ellipse> tag, you can easily draw an ellipse in SVG (Scalable Vector Graphics). It is shown in below code:
<ellipse cx = “200” cy = “200” rx = “200” ry = “100”/>
An ellipse contains the following attributes:
cx – It denotes the coordinate of x for the center of the ellipse.
cy – It denotes the coordinate of y for the center of the ellipse.
rx – It represents the height of the ellipse.
ry – It represents the width of the ellipse.
The SVG ellipse can be determined as shown in below code-
<svg width = “400” height = “400”>
<ellipse cx = “200” cy = “200” rx = “200” ry = “100” fill = “blue” />
</svg>
Example
An example is given below to create an SVG ellipse:
<!DOCTYPE html>
<html>
<head>
<script type = "text/javascript" src = "https://d3js.org/d3.v4.min.js"></script>
</head>
<body>
<div id = "svgcontainer"></div>
<script>
var width = 400;
var height = 400;
var svg = d3.select("#svgcontainer")
.append("svg")
.attr("width", width)
.attr("height", height);
 svg.append("ellipse")
  .attr("cx", 200)
  .attr("cy", 200)
  .attr("rx", 200)
   .attr("ry", 100)
    .attr("fill", "blue")
</script>
</body>
</html>
Output
After the successful execution of the above code, you will get the following result:
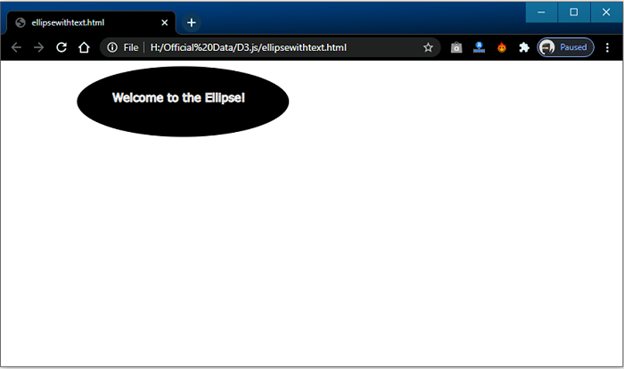
Create the Text Element on Ellipse
You can also include the text on the created ellipse. It can be done by using <text> tag as shown in below code:
<text x = “250” y = “50” >Enter Your Text Here </text>
An ellipse with the text contains the following attributes:
x – It denotes the coordinate of x for the center of the ellipse.
y – It denotes the coordinate of y for the center of the ellipse.
The SVG ellipse with the text can be defined as shown in below code-
<svg width = “400” height = “400”>
<text x = “250” y = “50” >Enter Your Text Here </text>
</svg>
Example
Here, we have an example to create an ellipse with the text as shown in the below code:
<!DOCTYPE html>
<html>
<head>
<script src="https://d3js.org/d3.v4.min.js"></script>
</head>
<body>
<script>
var width = 400;
var height = 400;
var svg = d3.select("body")                //Create SVG element
.append("svg")
.attr("width", width)
.attr("height", height);
var g = svg.append("g")                       //Create group element
.attr("transform", function(d, i) {
return "translate(0,0)";
});
var ellipse = g.append("ellipse")     //Create and append ellipse element into group
.attr("cx", 250)
.attr("cy", 50)
.attr("rx", 150)
.attr("ry", 50)
.append("text")
g.append("text")                        //Create and append text element into group
.attr("x", 150)
.attr("y", 50)
.attr("stroke", "white")
.text("Welcome to the Ellipse!");
</script>
</body>
</html>
Output