Steps to Create a Chart in VBA
Steps to Create a Chart
Charts are created either by directly working with the chart variable object that defines the chart data or by ChartObject method. In order to get to the object without an existing chart, you create a ChartObject on a given Worksheet and then get the Chart object from it.
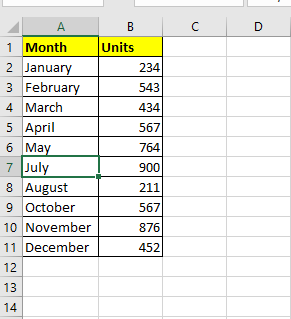
We should have an excel numeric data before creating any chart. Here, we have taken the sample data.
The below procedure explains the step by step creation of a simple bar Chart VBA program. We have used a few chart properties and features in the below code. But the user can modify or use the style or any other chart properties as per his requirement.
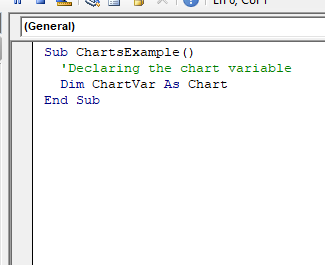
- Declare the chart variable
Create a new module and start the sub procedure. The next step is to declare the chart variable to return a single Chart object.
Program:
Sub ChartsExample()
  'Declaring the chart variable
  Dim ChartVar As Chart
End Sub
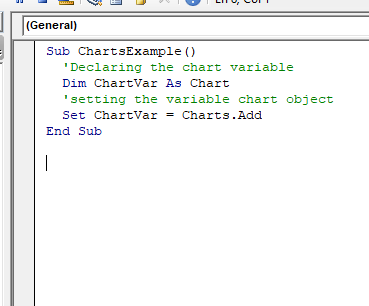
- Set the chart Variable
Now, as we have declared the chart object, we will set the chart object. The chart object is just a container that sets above all the ranges. It floats above all the cells on the worksheets and holds the actual chart. To set the chart object we must use the word ‘set’ along with the variable chart object equal to Charts.Add (Set ChartVar = Charts.Add).
Program:
Sub ChartsExample()
  'Declaring the chart variable
  Dim ChartVar As Chart
  'setting the variable chart object
  Set ChartVar = Charts.Add
End Sub
- Setting layout for Chart by ‘With’ statement
Using the ‘with’ statement to shorten the code length and defining as many properties within the with block. If you open a with statement you also have to end the with statement.
Program:
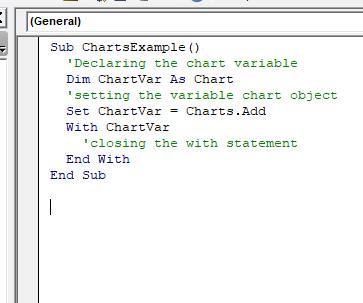
Sub ChartsExample()
  'Declaring the chart variable
  Dim ChartVar As Chart
  'setting the variable chart object
  Set ChartVar = Charts.Add
  With ChartVar
    'closing the with statement
  End With
End Sub
- Defining Source Data method
In the below program, we have used the set source data so as we can specify the data from the excel sheet to create the Chart.
Program:
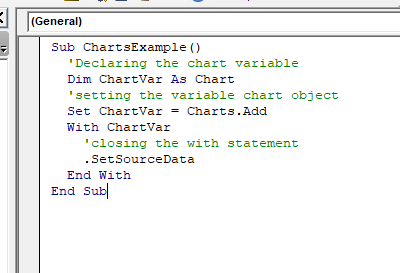
Sub ChartsExample()
  'Declaring the chart variable
  Dim ChartVar As Chart
  'setting the variable chart object
  Set ChartVar = Charts.Add
  With ChartVar
    'closing the with statement
    .SetSourceData
  End With
End Sub
- Setting Data Source Range
Specifying the range of Excel source data
Program:
Sub ChartExample()
  Dim ChartVar As Chart
  Set ChartVar = Charts.Add
  With ChartVar
          . SetSourceData Sheets("Sheet1").Range("A1:B7")
  End With
End Sub
- Selecting Chart Type property.
Now we have to create our chart. It is the visual representation of the data that we see unlike the pie chart, bar chart, line chart, etc. It lies inside of the chart variable.
Program:
Sub ChartExample()
  Dim ChartVar As Chart
  Set ChartVar = Charts.Add
  With ChartVar
          . SetSourceData Sheets("Sheet1").Range("A1:B7")
          .ChartType = xlColumnClustered
  End With
End Sub
- Changing the Tittle
We will apply a title for our chart. Firstly, we will enable the HasTitle property to TRUE.
Program:
Sub ChartsExample()
'Declaring the chart variable
Dim ChartVar As Chart
'setting the variable chart object
Set ChartVar = Charts.Add
With ChartVar
'closing the with statement
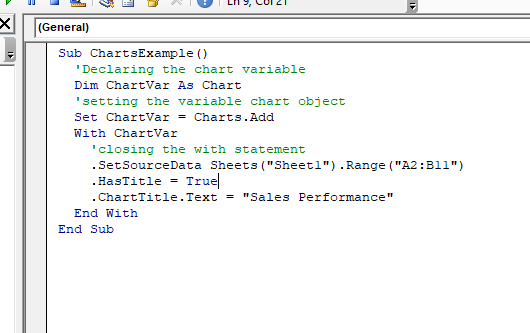
.SetSourceData Sheets("Sheet1").Range("A2:B11")
.HasTitle = True
.ChartTitle.Text = "Sales Performance"
End With
End Sub
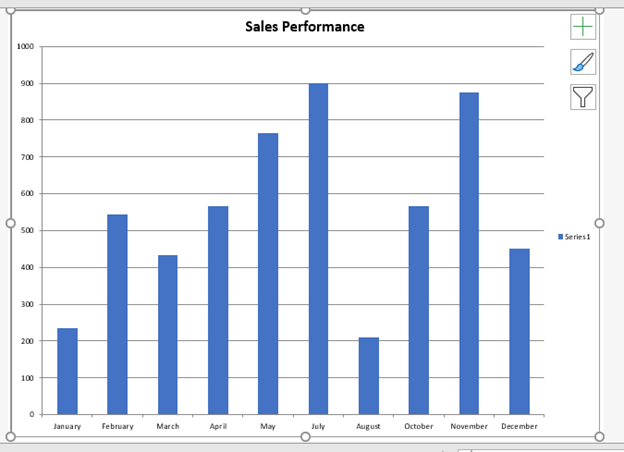
- Running the output
Once you are done with the code, press ALT + F5. You will notice in the footer of excel another sheet has been added with name Chart1 (default).
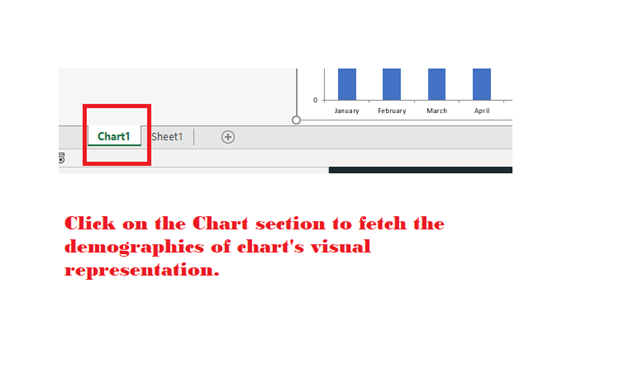
Output
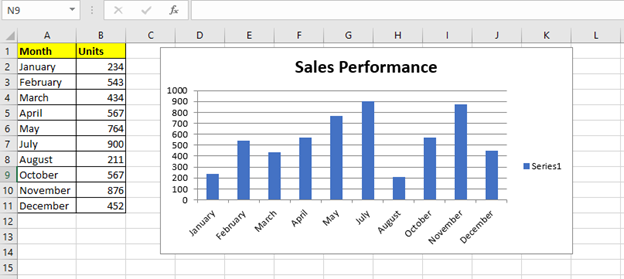
Creating chart with chartObject
The below example is the alternative of the above program. We have used the chartobject method. Here, instead of opening another chart sheet window unlike, in the above example, it will be created within your excel sheet next to your data. We have used the below code to set the dimensions of the chart window.
Set ChartVar = Wrksht.ChartObjects.Add(Left:=ActiveCell.Left, Width:=400, Top:=ActiveCell.Top, Height:=200)
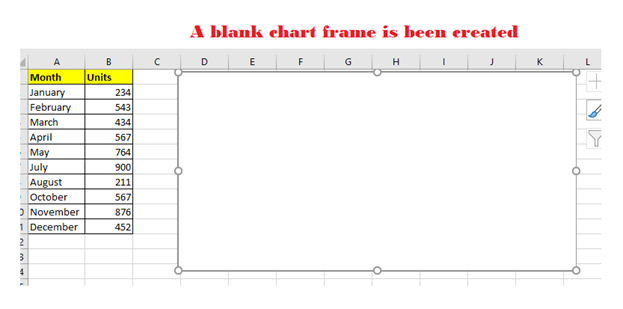
Even though you have specified the size, but you can still move the chart window manually once the chart is been created.
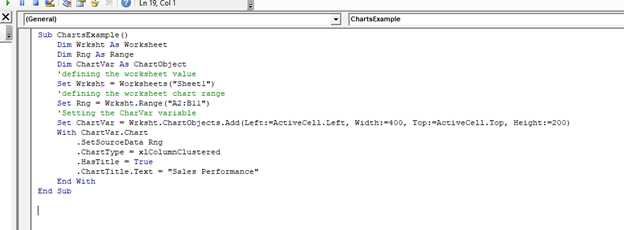
Program:
Sub ChartsExample()
    Dim Wrksht As Worksheet
    Dim Rng As Range
    Dim ChartVar As ChartObject
    'defining the worksheet value
    Set Wrksht = Worksheets("Sheet1")
    'defining the worksheet chart range
    Set Rng = Wrksht.Range("A2:B11")
    'Setting the CharVar variable and defining the chart frame dimensions.
    Set ChartVar = Wrksht.ChartObjects.Add(Left:=ActiveCell.Left, Width:=400, Top:=ActiveCell.Top, Height:=200)
    With ChartVar.Chart
        .SetSourceData Rng
        .ChartType = xlColumnClustered
        .HasTitle = True
        .ChartTitle.Text = "Sales Performance"
    End With
End Sub
Output