Some Important Quality Metrics
Important Quality Metrics
The best quality of software has to pass through various software quality measures to attain standard in quality. The quality executive should consider these metrics to monitor the quality of software, reach quality goals and improve the quality as much as possible.
1) Dynamic efficiency of software
Dynamic efficiency is the total number of CPU cycles required for the execution of software. It also measures the speed and accuracy of the CPU.
2) Static efficiency
Static efficiency = number of bytes required to execute a task. Bytes are related to RAM and ROM size.” How much bytes are used by the variables and program code.”
Random-access memory determines the global variable and runtime stack.
Read-only memory determines the fixed constant of a program code.
3) Power consumption: It measures the power consumed by software in the embedded system.
4) Correctness
Correctness metric measures the accuracy and correctness of the program source code in the embedded system.
5) Easy to understand
This measures how much rate the software (using on the microcontroller) is easy to understand or compatible with the embedded system.
6) Easy to change
Software must be flexible and have the maintainability feature in the embedded system as it makes changes quickly in the software.
Note: Dynamic, static, and power consumption are essential parameters to measure software quality for embedded applications.
7) Maintenance metrics
It is a metric for maintenance for software quality. Metric used for maintenance is named as SMI – {Software Maturity Index}and was given by IEEE std. 982.1 in 1988. It is an indicator of the stability of a product. Stability refers to the working condition of software in the market before and after the updation of its new version. The software index used for maintenance tells about the software stability in the market.
The standard formula for calculating SMI is:
SMI = [ MT –( Fa + Fc + Fd )] / MT
MT= Total Number of modules in the current release (modules after updation of software)
Fc = number of changed modules after the updation of the module.
Fa = number of newly added modules after the updation.
Fd= number of the currently deleted module (these modules were present before updation)
Note: The stability of the product increases as much as the value reaches 1.0.
For example, Let’s suppose,
MT = 100, Fa + Fc + Fd = 30
SMI = 100 – 30 / 100 = 70/100 = 0.7 < 1.0
Therefore the software quality is good, and after updation, it is very much stable. If the value comes <0.1, then the software is not stable for maintenance. Yet many other metrics come under maintenance metric like:
- Common maintenance metrics
- Asset performance metrics
- Operational metrics
- Inventory metrics
The most common maintenance KPIs revolve around key elements like downtime, cost, spending, safety and compliance, inventory management, efficiency, work order management, etc. So, maintenance metrics quantify the daily activity of management and scores the quality of software in the market as it visualizes a picture of the working of assets and people toward the product.
8) Capacity utilization rate
Capacity utilization rate is helpful in strategic planning and indicates market demand for the product. It calculates the percentage of used total output capacity at any given point.

9) Delivery metrics
Delivery metrics are based on two metrics based on which customer satisfaction and efficiency percentage are measured.
- POM (Perfect order metric) – This metric measures the percentage of orders that reached/ arrived on time, damage-free. Completely and with a correct invoice.
It is hard to achieve the range of good perfect order metrics.
- OTD (On-time delivery) - It tells how much percentage of units are delivered within on-time delivery.
10) Supplier quality metrics
Suppler play an essential role in quality costs. Some supplier quality metric is:-
- Supplier chargebacks –These are charges on suppliers for the cost of non-conforming materials, including late delivery and payroll costs.
- Supplier defect rate – The defective material from the supplier side does not meet the quality of the product to the customer side.
- Incoming supplier quality–It is the percentage of material that fulfills the quality requirement.
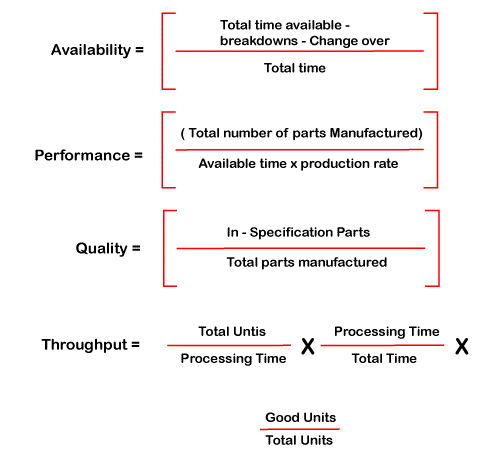
11) Throughput
Throughput is the result of the number of goods produced over a given period. It can be measured per machine, product line, and for the entire plant.

12) Overall equipment effectiveness (OEE)
Overall equipment effectiveness is the standard for measuring a total of product Availability, Quality, and Performance.
OEE = Availability x Quality x Performance
OEE is a proven way to monitor and improve process efficiency. It is a diagnostic tool as it just diagnoses the problem but doesn’t provide the solution. It is a KPI that measures the effectiveness and deviations from effective machine performance.
The goal of OEE is to reduce the six extensive equipment-based losses.
- Equipment breakdown
- Equipment setup and adjustment
- Minor stoppage
- The problem of reduced speed
- Start-up scrap
- Produced scrap
These goals come under categories:-availability losses, performance losses, and quality losses.
13) Scrap rate
Scrap rate is the result of the material that never becomes part of finished products. Various software lest as a scrap. It also calculates the wastage of time over making a product.

14) Customer complaints and returns
Customer complaints and return metrics set a benchmark data point and focus on continuous improvement of the existing product. It also helps in setting new goals for new products.
There are various methods of collecting and resolving customer complaints like emails, customer care centers, field service teams, phone, or direct compliant. Nowadays, social media is a booming platform for collecting negative and positive reviews about a product.
Customer complaints are resolved by measuring customer service performance.
Metrics used to measure customer service performance.
- Customer retention rate
- First response time
- Customer satisfaction score (CSAT)
- Customer effort score (CES)
- Customer service abandonment rates
- Average resolution time
- Sentiment analysis
- Resolution rate
- Net promoter score (NPS)
Customer return metrics are calculated as the rate of return.
Rate of return = Number of units return/ Number of units sold.
15) Defects
Defects can be calculated in two ways:-
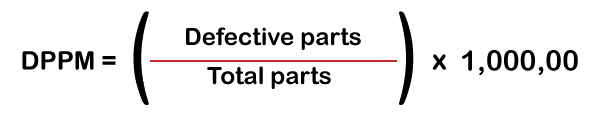
- Defective parts per million (DPPM)
For example:- Let’s say there are 25 pieces defective in a shipment of 1000 pieces. So, 25 /1000 = 0.25 defective.
DPPM = 0.025 x 1000000 = 25000 PPM
- Defects per million opportunities (DPMO)
DPMO is a long-term measure of process performance and the error rate of the process. It is also named as nonconformities per million opportunities (NPMO).
For example –For DPMO multiply it by 1 million
Number of defects = 7
Number of units = 50
Number of defects opportunities per unit = 4
DPMO = 7/ 50 * 4 *1000000 = 35000
Here, 35,000 opportunities are generated by committing defects or errors when 1 million orders are produced.
DPMO = 0 (best process possible)
DPMO = 1 million (worst process possible)

16) Cost of quality
It is one of most crucial metric which tells the actual cost of quality that is a combination of cost of good quality and cost of poor quality.
Software, cost of poor quality (SCOP) is due to internal or external failures like scrap, defect reach the customer, product liability, rework, re-inspection, warranty, corrections or removals, loss of brand reputation, product liability.
Software cost of good quality (SCOG) comprises appraisal cost and prevention costs such as quality audits, calibration, inspection and testing, quality planning, training, and statistical process control.