Bar Plot in Matplotlib
In this tutorial, we will see what is bar plot in matplotlib in Python and will learn how to plot it.
Meaning of bar plot
A bar plot is a chart that is taken into account to denote values graphically to make it easier to comprehend. It represents a group of data with the aid of rectangular bars, and the lengths and breadths are directly proportional to the values they represent. It describes the contrasts between the distinct categories. One plot's axes denote the explicit categories being compared, while the other denotes the measured values equivalent to those categories.
Creating a bar plot
The bar() function in Python is provided under the matplotlib API, which can be employed in MATLAB style or as an object-oriented Interface.
The syntax of the bar() function that is used with the axes in the following way:-
plt.bar(x, height, width, bottom, align)A bar plot confined with a rectangle is created through the above function, and the plot is dependent upon the given parameters. Considering an example of the bar plot, which represents the total number of students enrolled in unalike courses offered in an institute.
Illustration:
import numpy as np
import matplotlib.pyplot as plt


# creation of the dataset
data = {'PHP':18, 'Django':10, 'React':35,
'Python':40}
courses = list(data.keys())
values = list(data.values())


fig = plt.figure(figsize = (10, 5))


# creation of the bar plot
plt.bar(courses, values, color ='purple',
width = 0.5)


plt.xlabel("The offered courses")
plt.ylabel("No. of students enrolled in the course")
plt.title("Students enrolled in different courses")
plt.show()
Output:
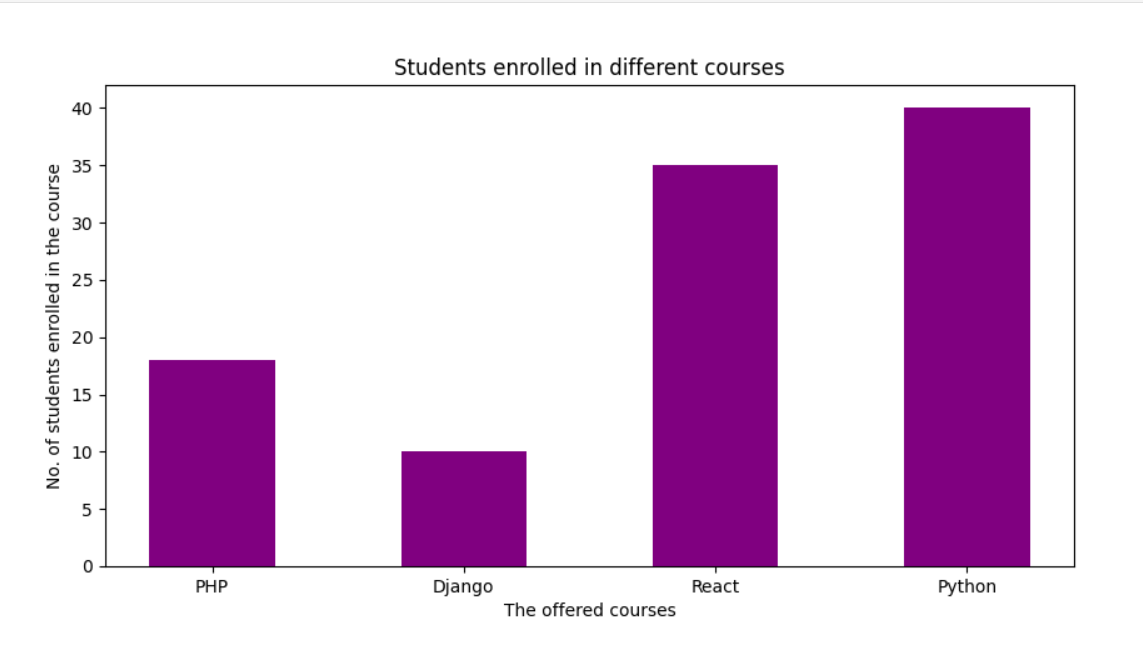
Here plt. bar(courses, values, color=’purple’) is used to specify that the bar chart is to be potted, where the courses column acts as the X-axis and the values as the Y-axis. The colour trait is taken into account to set the colour of the bars(purple in this case). plt.xlabel(“The offered courses”) and plt.ylabel(“students enrolled”) are taken into account to label the corresponding axes.plt.title() is taken into account to make a title for the graph.plt.show() shows the graph as output using the previous commands.
Illustration:
from matplotlib import pyplot as plt

plt.bar([5.85,2.25,3.15,3.25,4.85],[80,30,60,70,40],
label="vanilla",width=.5)
plt.bar([8.75,1.75,2.75,3.75,4.75],[80,20,20,50,60],
label="chocolate", color='r',width=.5)
plt.legend()
plt.xlabel('Days')
plt.ylabel('sales per day')
plt.title('Info')
plt.show()
Output:
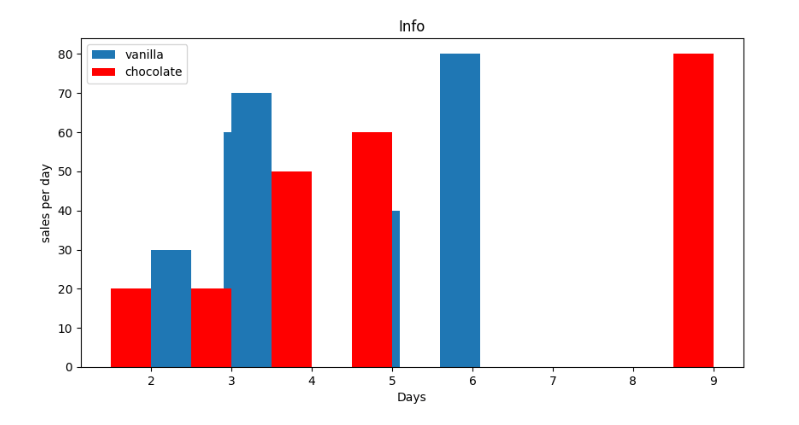
Illustration:
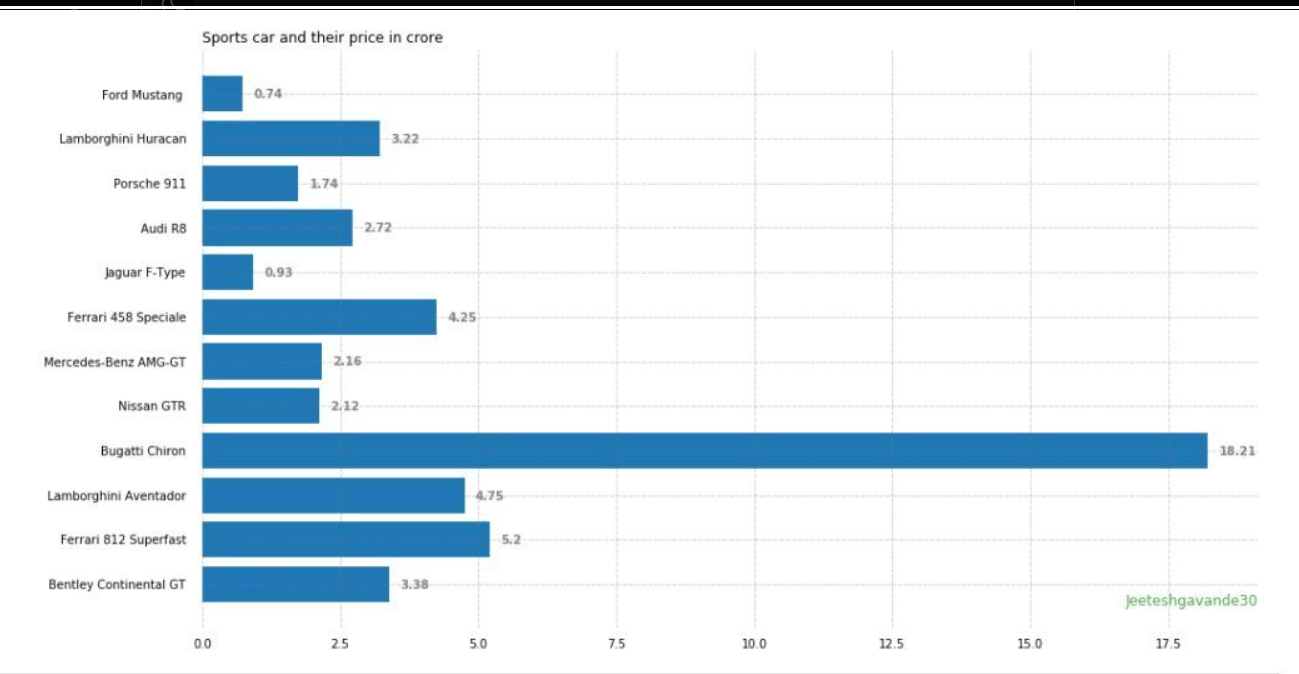
import pandas as pd
from matplotlib import pyplot as plt


# Reading CSV into pandas
data = pd.read_csv(r"cars.csv")
data.head()
df = pd.DataFrame(data)


name = df['car'].head(12)
price = df['price'].head(12)


# Size of the Figure
fig, ax = plt.subplots(figsize =(16, 9))


# Horizontal Bar Plot
ax.barh(name, price)


# Removing the axes splines
for s in ['top', 'bottom', 'left', 'right']:
ax.spines[s].set_visible(False)


# Remove x, y Ticks
ax.xaxis.set_ticks_position('none')
ax.yaxis.set_ticks_position('none')


# Adding the padding between axes and labels
ax.xaxis.set_tick_params(pad = 5)
ax.yaxis.set_tick_params(pad = 10)


# Add x, y gridlines
ax.grid(b = True, color ='grey',
linestyle ='-.', linewidth = 0.5,
alpha = 0.2)


# Showing the upper values
ax.invert_yaxis()


# Adding annotation to bars
for i in ax.patches:
plt.text(i.get_width()+0.2, i.get_y()+0.5,
str(round((i.get_width()), 2)),
fontsize = 10, fontweight ='bold',
color ='grey')


# Adding the Plot Title
ax.set_title('Sports car and their price in crore',
loc ='left', )


# Adding Text watermark
fig.text(0.9, 0.15, 'Jeeteshgavande30', fontsize = 12,
color ='grey', ha ='right', va ='bottom',
alpha = 0.7)


# Showing the Plot
plt.show()
Output:
Multiple bar plots
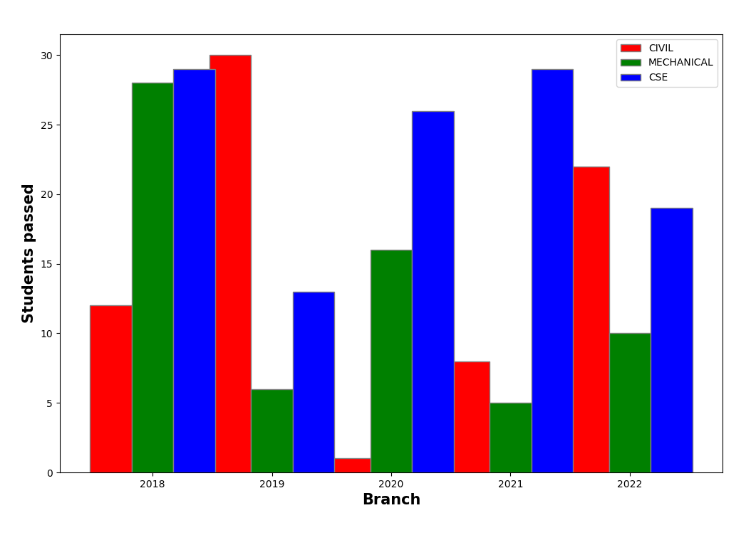
Multiple bar plots are taken into account to compare the set of data to be done when one variable is varying. It can be simply converted into a stacked area bar chart, where each subcategory is presented one on top of the others. It can be plotted by changing the breadth and location of the bars. The subsequent bar plot shows the number of students passed in the three engineering branches – civil, mechanical, computer science, and engineering.
import numpy as np
import matplotlib.pyplot as plt


# setting the thickness of bar
barWidth = 0.35
fig = plt.subplots(figsize =(12, 8))


# setting the tallness of bar
CIVIL = [10, 40, 11, 18, 12]
MECHANICAL = [25, 16, 13, 7, 9]
CSE = [29, 13, 26, 29, 19]


# Setting the position of bar on X axis
br1 = np.arange(len(IT))
br2 = [x + barWidth for x in br1]
br3 = [x + barWidth for x in br2]


# Make the plot
plt.bar(br1, IT, color ='r', width = barWidth,
edgecolor ='grey', label ='CIVIL')
plt.bar(br2, ECE, color ='g', width = barWidth,
edgecolor ='grey', label ='MECHANICAL')
plt.bar(br3, CSE, color ='b', width = barWidth,
edgecolor ='grey', label ='CSE')


# Adding Xticks
plt.xlabel('Branch', fontweight ='bold', fontsize = 15)
plt.ylabel('Students passed', fontweight ='bold', fontsize = 15)
plt.xticks([r + barWidth for r in range(len(IT))],
['2018', '2019', '2020', '2021', '2022'])


plt.legend()
plt.show()
Output:
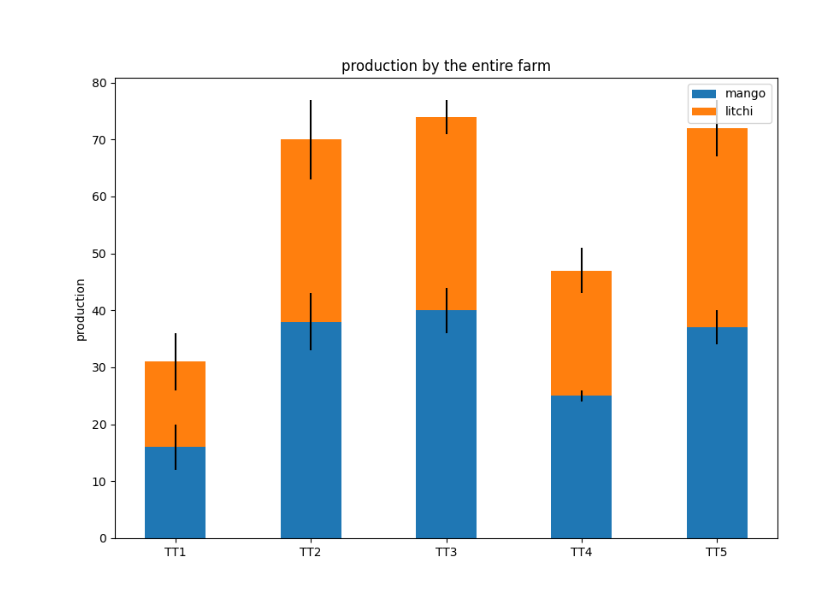
Stacked bar plot
Stacked bar plots denote distinct groups on top of one another. The bar height depends upon the resultant height of the grouping of the groups' results. It begins from the bottom and reaches the value rather than going from zero to value. The next bar plot denotes the production of mangoes and litchis of the entire farm.
import numpy as np
import matplotlib.pyplot as plt


N = 5


mango = (16,  38,  40,  25 , 37)
litchi = (15, 32,  34, 22, 35)
banana = (4, 5, 4, 1, 3)
guava = (5, 7, 3, 4, 5)
ind = np.arange(N)
width = 0.45


fig = plt.subplots(figsize =(10, 7))
p1 = plt.bar(ind, mango, width, yerr = banana)
p2 = plt.bar(ind, litchi, width,
bottom = mango, yerr = guava)


plt.ylabel('production')
plt.title('production by the entire farm')
plt.xticks(ind, ('TT1', 'TT2', 'TT3', 'TT4', 'TT5'))
plt.yticks(np.arange(0, 81, 10))
plt.legend((p1[0], p2[0]), ('mango', 'litchi'))


plt.show()
Output:
Summary:
In this tutorial, we saw how to use bar plots in matplotlib in python language through practical implications.