JOGL - Basics of Graphics
Vector and Raster graphics
1. Vector Graphics:
Vector Graphics consists of paths, the mathematical formula associated with each path tells how it is shaped. Vector Graphics are mainly used for creating logos, icons, graphs. They support very small sizes. Vector Graphics is a collection of paths having sequential commands, mathematical statements, and programs attached with them to draw 2D or 3D graphics. In order to draw continuous and smooth lines vector graphics are used. The cost is more in the case of vector graphics but it requires less space. The extension of file used in vector graphics used are .eps, .pdf, .svg. In the case of vector graphics images are formed by drawing the lines or curves between the points to generate different shapes. Vector Graphics have the advantage of scaling. The lines or curves can be scale in the vector direction. The two-dimensional computer graphics uses vector graphics. One can infinitely zoom in vector graphics shapes.
Advantages of Vector Graphics:
- Original resolution is maintained
- Vector Graphics is scalable without any loss
- Small file size
- Easier to raster
- Smoother lines and Sweeping curves
Disadvantages of Vector Graphics:
- Complex graphics is not supported by vector graphics
- It requires rasterization
- Small errors are only visible when the image is enlarged
- Detailed image property is not easily visible
2. Raster Graphics:
Different colored pixels are composed to display an image in raster graphics. Raster Graphics is used in the case of digital photography. Raster Graphics represents the dot matrix structure. It is generally rectangular grid consists of pixels. The bitmap is a rectangular grid of pixels. Raster Graphics requires less cost but acquire more space. File extension used in Raster Graphics are .gif, .jpg, .bmp. Raster Graphics is also called bitmap graphics.
Advantages of Raster Graphics:
- Raster Graphics makes it easy to execute overlay operations.
- It is used for simulation
- Continuous features data is represented using raster graphics
Disadvantages of Raster Graphics:
- In Raster Graphics, feature resolution is dependent on cell size.
- Raster Graphics images cannot be enlarged in size very well.
- Raster Graphics are not suitable for implementing topological representation.
2D Computer Graphics:
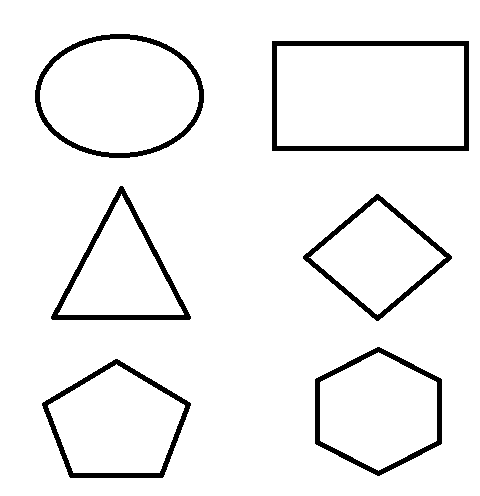
The digital images in the 2D computer graphics are formed using lines, points, text. The 2D computer graphics object is an object without any depth. It is used in printing and drawing 2D computer graphics. The basic primitives such as lines, circles as well as polygons are included in the 2D graphics. Bitmap and vector are the two types of 2d computer graphics. Shapes are drawn on an X-Y scale.
Some of the 2D shapes:
3D Computer Graphics:
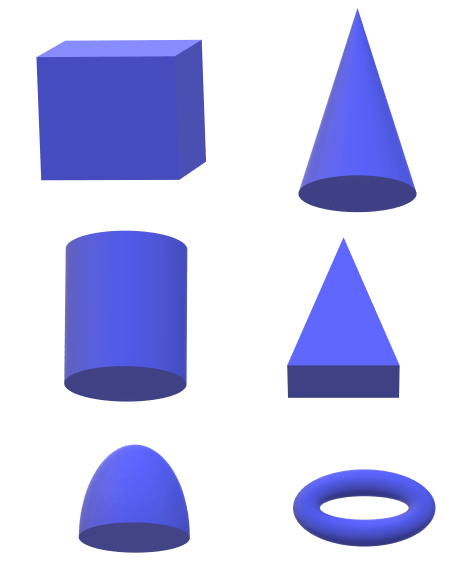
The extension of 2D computer graphics is called 3D computer graphics. Shapes in 2D are drawn on an X-Y scale whereas, in 3D X, Y, and Z coordinates are being used for drawing shapes. The 3D objects can be rotated and viewed from any angle. The Projection task can be performed using 3D computer graphics. 3D computer graphics are used in real-time games and applications.
Some of the 3D shapes:
Graphics Transformation:
Sometimes there is a need to shift, rotate, enlarge the pictures or images. The transformation will help to apply this effect to a particular shape.
There are three types of transformation:
1. Translation: When we want to shift one place to another place transformation is used. If the coordinates of the point are x1 and y1 and we want to shift the point to location x2 and y2, we have to add translation factors Tx along the x-axis and Ty along the y-axis.
Equation: x2=x1+Tx
y2=y1+Ty
2. Rotation: If we want to rotate a point about around an axis rotation is used. If we want to rotate point P (x1, y1) clockwise by angle 90 the equations will be x2=x1.cos90+y1.sin90
y2=x1.sin90-y1.cos90
3. Scaling: If we want to increase or decrease the size of the image, scaling is used. It can be done from one side or both sides. Suppose point Q (x1, y1) has to be scaled by Sx and Sy along x and y direction respectively, we use the formula
x2=x1*Sx
y2=y1*Sy
The two other transformation techniques commonly used are:
- Reflection: When we want to generate a mirror image of an object reflection is used. Reflection can be performed along the x-axis, y-axis, and origin.
- Shearing: It is generally is used when we want to slant the object. In y-shearing, y coordinates are changed as y’=y+Syx. In x-shearing, the x coordinate is changed as x’=x+Sxy.