Difference Between DFD and ERD
Data refers to the information, flow refers to movement and diagram refers to the pictorial representation of something. Hence, DFD specifies the graphical or pictorial representation of data movement in a framework or data system. Further, ERD stands for entity-relationship model where an entity represents the object to collect data, relationship tells about their connection and diagram refers to the pictorial or graphical representation of something. The flow of information and data within a system is described by two different types of diagrams: entity connection sketches, or ERDs, and data stream diagrams, or DFDs. Data flow among procedures, storage devices, and outside parties is modelled using DFD.
What is a Data Flow Diagram (DFD)?
Organizations, procedures, flows of data, and information stored are the four components of DFD. Examples of organizations that are outside sources of information or destinations are vendors, consumers, and staff members. Processes are the operations or jobs that convert data into valuable data. While data stores are locations where data is kept for later use, information flows are the paths that information travels as it travels throughout the framework.
DFD is an organizational diagram in which a deeper view of the structure is given at each level. The top level of DFD, Level 0, shows the primary information flows and operations in the framework and summarises it. Additional information is included as the figure descends, exposing the information streams and procedures in greater detail.
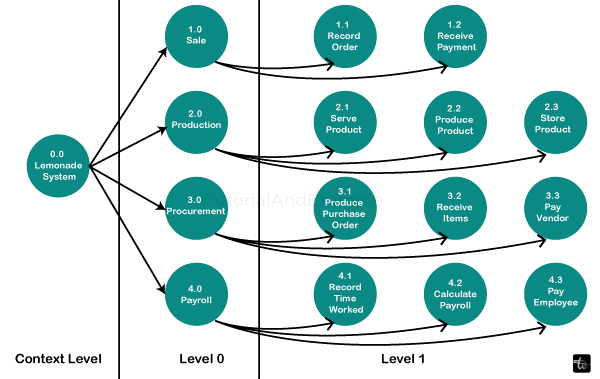
DFDs such as Context Diagram, Level 0 DFD, Level 1 DFD, and so on can be used to model different system components. A context diagram, which depicts the system as a single process with data entering and leaving it flows, is the most complex form of DFD. Level 0 DFD is the initial level of decomposition; it divides the single process into its main sub-processes. Level 1 DFD builds upon Level 0 DFD processes by decomposing them down to increasingly intricate subprocesses, and so forth.
Applications for DFD are numerous and include design, records, and system analysis. It provides stakeholders with an easy-to-understand representation of the system, enabling them to comprehend the movement of data and see potential problems or enhancements.
What is Entity Relationship Diagram (ERD)?
An Entity Relationship Diagram (ERD) shows entities and their associations graphically. It is employed to model the connections between the things that make up the structure of a database and the network itself. ERD is composed of entities, attributes, and relationships. In a system, entities are concepts or objects; their connections are described by their contacts, and their features explain their characteristics. The representation of the data model and its connections, which is made possible by ERD, aids in the detection of potential problems with the quality of the data and guarantees the maintenance of data consistency.
The fundamental elements of an ERD are:
Entities: The system's easily recognized and defined objects or concepts are called entities. Rectangles are used in an ERD to symbolize entities.
Attributes: A quality or characteristic of an entity is called attribute. An oval form attached to an object serves as its representation.
Relationships: A connection is an alliance established by several parties. It is shown as a line joining the two organizations in an ERD.
Cardinality: Something that can be quickly recognized and explained. The total amount of ways an entity can be related to another is known as its cardinality. In an ERD, it can be shown as symbols like "one," "many," or "zero" on the lines that interconnect the various entities.
It is simple to identify and characterize an entity. Complex or essential, ERD may be employed to model any database system. The procedures related to establishing an ERD include as follows:
- Determine the entities. It is simple to identify and characterize an entity. Finding the entities in the framework under examination is the first step in developing an ERD. These separate things represent the items or concepts of the system.
- Determine the attributes: After the entities have been identified, the following stage is to determine the characteristics or traits of each entity. These qualities aid in comprehending the features of every entity.
- Determine the connections. Finding the relations among the things comes next, following the identification of the entities and their characteristics. Seeing the relationships between entities and their cardinality is necessary for this.
- Sketch the ERD − It is simple to identify and characterize an entity. Ultimately, the entities can be represented as rectangles, the characteristics as ovals associated with the organizations, and the relationships as lines joining the entities with the appropriate cardinality symbols to construct the Entity Relationship Diagram (ERD). Entity Relationship architecture (ERD) is an effective method in database design that ensures data is reliable and accurate by identifying any issues with data quality and making sure entity links are described correctly. Entity-relational architecture (ERD) is an effective method in the design of databases that ensures data accuracy and integrity by identifying any issues with data quality and making sure object links are described correctly
Comparison chart
| Data Flow Diagram (DFD) | Entity Relationship Diagram (ERD) |
| The acronym for this is DFD.Representing the procedures and the data flow within them is the primary goal.It describes the flow and procedures for storing, processing and generating data.Rectangles (which indicate the data entity), circles (which point to the process), arrows (which indicate the data flow), ovals, or parallel lines (which show data storing) constitute the icons used in DFD.DFD adheres to the requirement that there be a minimum of one information flow going into and out of the procedure or storage.It simulates how data moves across an infrastructure. | Entity Relationship Diagram or Model is what it stands for.Representing the data object, entity, and its connection is the primary goal.It illustrates and clarifies the connections among the objects kept in a database.Rectangles (which represent the entity), diamond boxes (which depict relationships), lines, and conventional notations (which indicate cardinality) are symbols used in ERDs.The ERD mandates that every entity reflect the collection of related items.It simulates how data moves across a system. |
Key Differences between DFD and ERD
Difference in Methodology
The process of inputting, manipulating, and saving data is typically reflected in DFD. Moreover, in DFD, units are typically handled separately according to specific criteria, with the possibility of interactive linking between them all. The logistics manager often uses the App system to verify and update the stock of each product, as demonstrated in this DFD instance.
Variations in Presentations
There are defined symbols in two different shapes and connections for these two diagram styles. DFD models, on the other hand, depict an intricate framework comprising several distinct sections containing a great deal of data. Boxes and diamonds are arranged in an almost concept map-like manner to illustrate the links among entities in ERD models, as is evident from looking at them.
Both DFD and ERD models have limitations when it comes to applications in real-time. Because of this, neither of these two data flow models—despite their widespread use—can adequately capture the overall picture for one project at a time. As a result, managers of departments or organizational leaders ought to utilize a variety of data flow diagrams and models to analyze the information they possess. For your projects, you can also experiment with certain DFD and ERD schematic design applications.
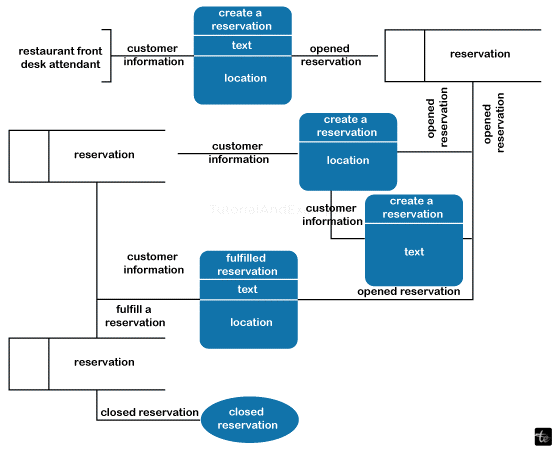
Samples of DFD Diagrams
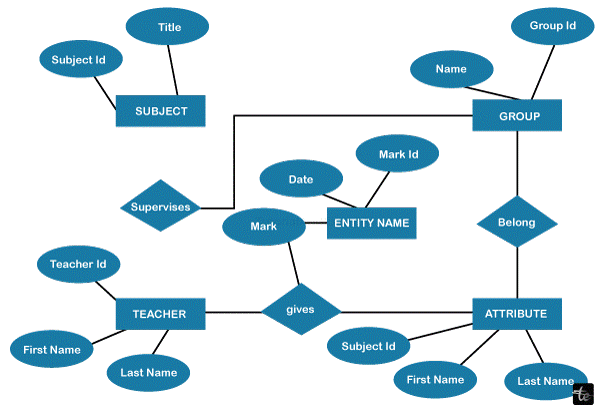
On the other hand, ERD presents the general structure of the information system without delving deeply into the details of its database implementations. An Entity in an ERD typically represents a collection of related items. ERD models theoretically illustrate how the data units are logically sorted into organizations in this situation. A blog post could be a data unit, while the blog and its author, etc., could represent a connection. In addition, EDR physically means the way that data pieces are technically kept in a database. You can see another instance of academic staff handling data in the ERD that follows.ERD is an illustration for use in classes
.
Samples of ER Diagrams
These are a few samples of entity relationship diagrams. The design document is available for free download. To change the content, double-click on the shapes you want to modify. Try using the theme functionality to alter the outline, colour, and font to modify the style.
ER Diagram for the Employment Sector
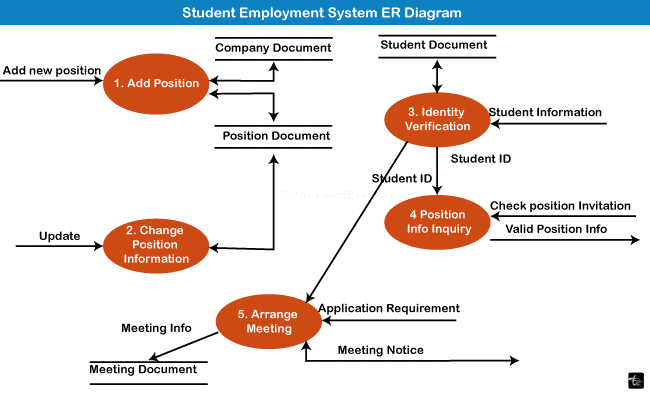
To obtain the initial version, click on the image of the entity connection diagram for the work system.
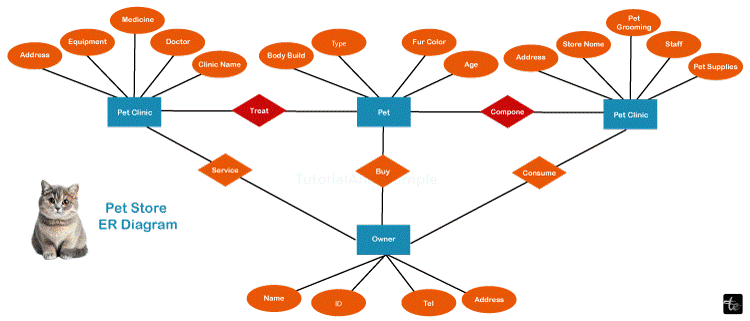
ER Diagram for the Labour Sector
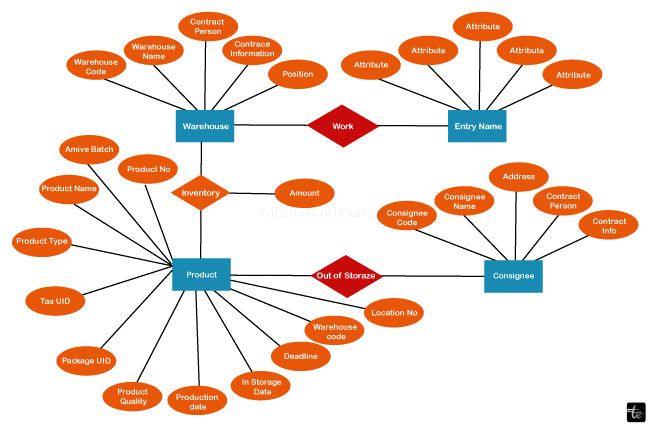
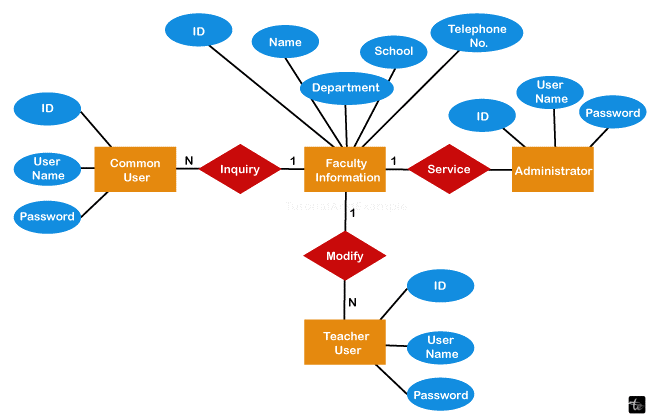
Illustration of Storage System ER
Entity, relationship, and attribute symbols are used in the storage system ER diagram to represent the relationships between entities within the system.