ER Diagram for Online Shopping
Introduction
In DBMS, ER diagram for an online shopping system shows how the databases are connected to each other. It also shows how all the databases are logically related to each other. We can also create an ER diagram by drawing the figure of a different part of the online shopping system and their properties and how they perform their task.
We can draw an ER diagram of the online shopping system by drawing the design of the database. The sketch of the database became the storage of the database where the data comes and goes.
Details Online Shopping System ER Diagram
Now we describe the overall function of the Online Shopping System in the below table. It is a complete overview of the information about the online shopping project.
| Name: | ER Diagram of the Online Shopping System. |
| Abstract: | The ER Diagram of the Online Shopping system shows the relationship between various entities. We can also call it the blueprint of the online shopping system. |
| Diagram: | We can also call the ER diagram an Entity Relationship diagram. |
| Tool used: | The ER diagram provides some symbol that is known as the diagramming tool. |
What is Online Shopping System?
The online shopping system is a type of electronic commerce system that allows the customer to buy goods and services over the internet. It can be done via a mobile app or web browser.
Features of Online Shopping Entity Relationship Diagram
There is some feature of the Entity Diagram of online shopping system. These are as follows.
- Shopping Management: It can save all shopping-related information. It also acts as the basis of admin for the order of the customer.
- Customer Management: It also collects all the important information about the customers. This collected information was used to determine the order and transaction of the customer.
- Manage Transactions: This feature also allows the admin to monitor the transaction made by the customer. It also stores all the transactions made by the customer and the shopping information of the customer.
- Transactions and Reports Management: This feature also stores the transaction made by the customer. It also collects the report and information of all the transactions made by the customer.
What is an ER Diagram?
We can also call ER diagram the database design for the online shopping system project. The ER diagram is like a picture that contains how all the entities are related to each other. The most important part of the ER diagram is Relationships, Attributes, and Entities.
Importance of ER Diagram
The ER diagram for the project is the foundation for the building of the database of the project. The properties, datatypes, and attributes are defined by the ER diagram.
ER Diagram for Online Shopping System
The ER diagram for the online shopping system, the system data, and their attributes. The data and the attributes are represented by the table, and the table shows how they are related to each other.
Database design for the Online Shopping system
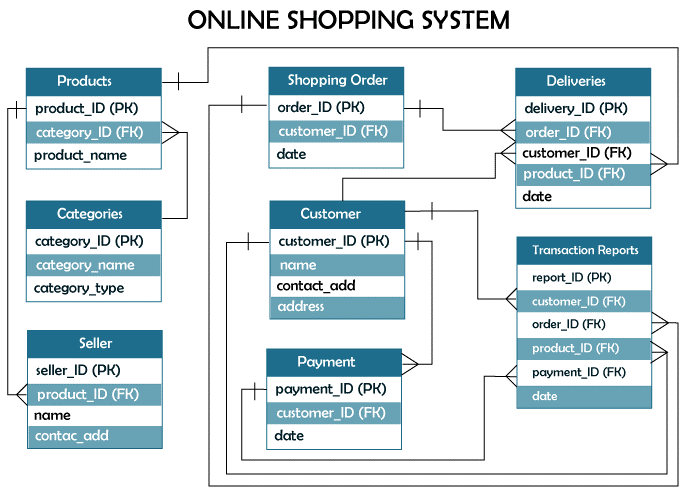
The above diagram shows the database design for the online shopping system. This database design shows all the system data, and the output for the user ate stored in the database. In DBMS, a good ER diagram is needed for the creation of an online shopping system.
Online Shopping System ER Diagram Tables
The below table shows all about the field name of the table, description, datatype, and character length. Each table of the ER diagram defines and explains the data storage.
The field column lists all the attributes of the database that describes each column. The types table of the database shows what kind of data each attribute is, and the length shows how many characters it has.
Table Name: Customer
| Field | Description | Type | Length |
| customer_ID (PK) | Customer ID | Int | 11 |
| name | Customer Name | Varchar | 255 |
| contact_add | Customer Contact | Int | 11 |
| address | Customer Address | Text |
Table Name: Categories
| Field | Description | Type | Length |
| category_ID (PK) | Category ID | Int | 11 |
| category_name | Category Name | Varchar | 255 |
| category_type | Category Type | Varchar | 255 |
Table Name: Shopping Order
| Field | Description | Type | Length |
| order_ID (PK) | Order ID | Int | 11 |
| customer_ID (FK) | Customer ID | Int | 11 |
| date | Date of Order | Date |
Table Name: Deliveries
| Field | Description | Type | Length |
| acc_ID (PK) | Account ID | Int | 11 |
| customer_ID (FK) | Customer ID | Int | 11 |
| date | Date of Delivery | Date |
Table Name: Products
| Field | Description | Type | Length |
| product_ID (PK) | Product ID | Int | 11 |
| category_ID (FK) | Category ID | Int | 11 |
| product_name | Product Name | Varchar | 255 |
Table Name: Seller
| Field | Description | Type | Length |
| seller_ID (PK) | Seller ID | Int | 11 |
| product_ID (FK) | Product Name | Int | 11 |
| seller_name | Seller Name | Varchar | 255 |
Table Name: Payment
| Field | Description | Type | Length |
| payment_ID (PK) | Payment ID | Int | 11 |
| customer_ID (FK) | Customer ID | Int | 11 |
| date | Date of Payment | Date |
Table Name: Reports
| Field | Description | Type | Length |
| report_ID (PK) | Report ID | Int | 11 |
| customer_ID (FK) | Customer ID | Int | 11 |
| order_ID (FK) | Order Id | Int | 11 |
| product_ID (FK) | Product Id | Int | 11 |
| payment_Id (FK) | Payment Id | Int | 11 |
With the help of the above tables, we can set up the database for the online shopping system. It provides the full description of the database with its table names. They will enter all the values and attributes for the database in the table.
How to create ER Diagram
We can create the ER diagram for the table just in 5 minutes. There are some steps, and with the help of these steps, we can build the ER diagram for the online shopping system project. The steps are as below.
Step 1:
We have to familiarize ourselves with the entity relationship diagram cardinality and symbols. Then we have to show the data structure for the project in the entity relationship diagram. The symbol of the entity relationship diagram shows how they fit together. Before making the ER diagram, we should properly know the meaning of all the symbols and how to use all of them symbols.
Symbol of entity relationship diagram:-
- Fields: This entity shows how the different types of data are used together for a project. The symbol is used to show how the part of the project is working.
- Key: It is a type of technique that is used to categorize the quality of the data. There are two types of keys available for the database. These are as follows.
- Primary key: It is a set of unique properties that are used for finding the specific entity.
- A foreign key: It is a type of key made up of a piece of data with too many links to other things.
Step 2: Finalize the entities included
Start making your ER Diagram by deciding on all the parts your online shopping system must have. You’ll need to leave the area in your design for these rectangles to be included later.
Step 3: Add the attributes of each entity
After you’ve decided on the entities, think about the traits you’ll need for each one. In a conceptual ER diagram, the details of the different entities are given as attributes. Attributes are things like a thing’s traits, a many-to-many relationship, or a one-to-one relationship. Attributes with multiple values can be given more than one value.
Step 4: Describe the relationships (cardinality) between entities and attributes
You will need the entities, their attributes, and the relationships between them in order to plot the relationships between the ERD. To get the right entity relationship diagram, you will use the information you gathered to build the data structure.
Conclusion
You need to know how the online shopping System was designed and built using diagrams. With the help of an ER diagram will help you make a system that works well.
Making it will help you understand how the software works behind the scenes. This is where all the data that goes in and out of the system will be stored.