Pandas Commands
In this article, we will discuss Pandas commands, but we should know about the pandas library in Python before knowing this.
What is Pandas in Python?
Pandas is a library typically used for data analysis and manipulation in Python programming. It is a dataFrames in Python.
To manage tabular data, utilize Pandas. In particular, it offers the data format and management tools for time series and monetary tables. "panel data" is where the name "Pandas" originates. Pandas should be used extensively for machine learning model creation, data manipulation, and visualization.
- Dataframes
- Series
How to Install Pandas
Pandas didn't come by default while installing Python. To install pandas, you have to open your command prompt and write the given command:
pip install pandas
Or
If you are using anaconda, then open the anaconda prompt and write the command given below:
conda install pandas
To install a specific pandas version:
conda install pandas=0.20.3
NOTE: Pandas supports the Python programming language's 3.8, 3.9, and 3.10 versions.
Getting Started with Pandas
After installing Pandas on your device, import Pandas and write this on top of the code, you have to remember some important points about pandas.
- Pandas use DataFrame to store a table. A DataFrame is a 2-dimensional data structure, and the size of the DataFrame is mutable.
- Every column in a DataFrame is a Series.
- A DataFrame or Series can be used to perform operations by applying methods.
Some Useful Commands of Pandas
To work with tabular data, pandas provide many functions. Let’s have a look at some of those commands.
1. Commands to read tabular data
Pandas support many file formats such as CSV files, excel files, JSON files, SQL files etc. Pandas have different functions to read files according to their format. All read functions have the prefix "read_". These read functions return a DataFrame.
General Syntax of reading a tabular data:
Reading a csv file:
my_data = pandas.read_csv("path of file")
Reading a excel file:
my_data = pandas.read_excel("path of file", sheet_name="name of sheet")
Reading a JSON file:
my_data = pandas.read_json("path of file")
Example: Let’s understand it by taking an example.
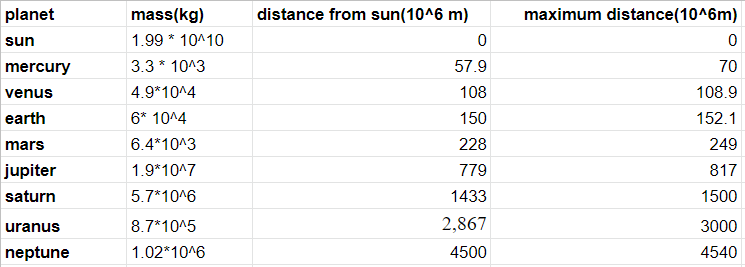
Suppose we have tabular data like this in CSV file format. Suppose the name of the file is solarSystem.csv and in the same directory. Let’s try to read it.
# code goes from here
import pandas as pd


my_data = pd.read_csv("solarSystem.csv")
print(my_data)
Output:
    planet          mass(kg)          distance from sun(10^6 m)     maximum distance(10^6m)
0      sun        1.99 * 10^10                      0                       	 0.0
1  mercury      3.3 * 10^3              	     57.9                    		 70.0
2    venus       4.9*10^4                       108                      		108.9
3    earth         6* 10^4                         150                     		152.1
4     mars        6.4*10^3                        228                    		249.0
5  jupiter        1.9*10^7                        779                    		817.0
6   saturn        5.7*10^6                       1433                  		1500.0
7   uranus       8.7*10^5                       2,867                 		3000.0
8  neptune     1.02*10^6                      4500               		4540.0
2. Commands to write data in the file
Using this command, we can write Excel or CSV files in the Pandas framework.
If you want to write to Excel file, command as follow:
DataFrame.to_excel(" path of the file/file_name.xlsx")
Note: to write in excel format, you must install the openpyxl module from pip.
If you want to write to CSV file, command as follow:
DataFrame.to_csv(" path of the file/file_name.csv")
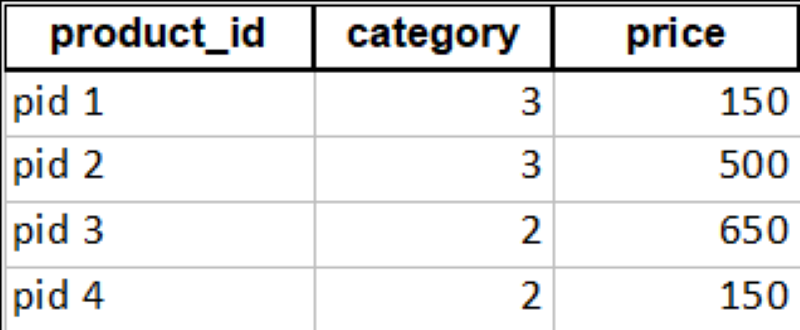
Example: Let’s understand this by implementing an example given below:
# code goes from here
import pandas as pd


data = pd.DataFrame([
        ["pid 1", 3, 150],
        ["pid 2", 3, 500],
        ["pid 3", 2, 650],
        ["pid 4", 2, 150]
    ]
    , columns=["product_id", "category", "price"]
)
data.to_excel("products.xlsx", sheet_name="sheet1", index=False)
Output:
3. Commands for getting data from Table
To select a particular column:
column_1 = df["column_name"]
Or
column_1 = df.get("column_name")
Example: Let’s understand it by taking an example.
Let’s try to fetch the names of all planets from the above Table.
# code goes from here
#import pandas
import pandas as pd


my_data = pd.read_csv("solarSystem.csv")


planets = my_data["planet"]
print(planets)
Output:
0        sun
1    mercury
2      venus
3      earth
4       mars
5    Jupiter
6     Saturn
7     Uranus
8    Neptune
Name: planet, dtype: object
To select a particular row:
rows = df["condition that should followed by rows"]
Example: Let’s understand it by taking an example.
Let’s select the rows with a distance greater than 300 from the table.
# code goes from here
import pandas as pd


my_data = pd.read_csv("solarSystem.csv")


planets = my_data[my_data["distance from sun(10^6 m)"] > 300]
print(planets)
Output:
       planet   mass(kg)      distance from sun(10^6 m)  maximum distance(10^6m)
5      jupiter   1.9*10^7                      779.0                    817.0
6      saturn   5.7*10^6                     1433.0                   1500.0
7      uranus   8.7*10^5                     2867.0                   3000.0
8     neptune  1.02*10^6                   4500.0                   4540.0
To Select particular rows and columns:
new_data = df.loc["condition followed by rows", ["column_name"]]
Or
new_data = df.iloc[start_row : end_row, start_column : end_column]
Example:
Let’s try to select the planet name and mass, and the distance is greater than 300 from the Table.
# code goes from here
#import pandas
import pandas as pd


my_data = pd.read_csv("solarSystem.csv")


planets = my_data.loc[my_data["distance from sun(10^6 m)"] > 300, ["planet", "mass(kg)"]]
print(planets)
Output:
	planet   	mass(kg)
5  	jupiter   	1.9*10^7
6   	saturn   	5.7*10^6
7   	uranus   	8.7*10^5
8  	neptune  	1.02*10^6
4. Transform command in pandas
To modify values of DataFrame:
df = df.transform(function)
Example: Let’s capitalize the names of planets
# code goes from here
#import pandas
import pandas as pd


my_data = pd.read_csv("solarSystem.csv")


my_data["planet"] = my_data["planet"].transform(lambda x: str(x).capitalize())
print(my_data["planet"])
Output:
0        Sun
1    Mercury
2      Venus
3      Earth
4       Mars
5    Jupiter
6     Saturn
7     Uranus
8    Neptune
Name: planet, dtype: object
5. Command to merge two data frames
In this, we can merge two data frames to create a single data frame. And also we can choose which columns to make common as well.
We write this command as:
pd.merge(dataframe_1,dataframe_2)
Let’s understand this by implementing an example given below:
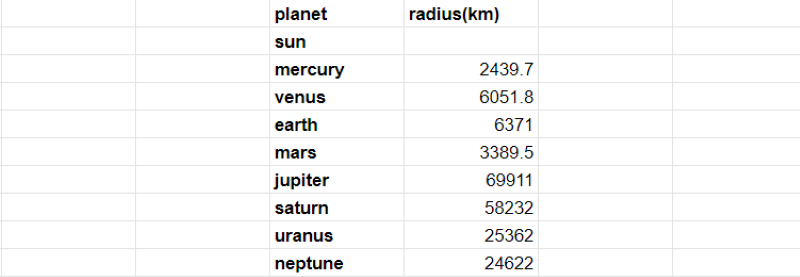
Example: Let’s try to merge a new table PlanetRadius with the old planet table.
# code goes from here
#import pandas
import pandas as pd


df1 = pd.read_csv("solarSystem.csv")
df2 = pd.read_csv("PlanetRadius.csv")


new_data = pd.merge(df1, df2)
print(new_data)
Output:
planet      	mass(kg)  ...  maximum distance(10^6m)  radius(km)
0      sun  	1.99 * 10^10  ...                   0.0         	NaN
1  mercury    3.3 * 10^3  ...                     	70.0      	2439.7
2    venus      4.9*10^4  ...                    	108.9     	6051.8
3    earth       6* 10^4  ...                    	152.1      	6371.0
4     mars      6.4*10^3  ...                    	249.0      	3389.5
5  jupiter      1.9*10^7  ...                    	817.0     	69911.0
6   saturn      5.7*10^6  ...                   	1500.0     	58232.0
7   uranus      8.7*10^5  ...                   	3000.0     	25362.0
8  neptune     1.02*10^6  ...                   	4540.0     	24622.0


[9 rows x 5 columns]
Note: In this, two frames are merged into a single DataFrame, but if we want to specify the common column, then it will be done by making a column. We write this command as:
pd.merge(dataframe_1,dataframe_2,on=”Column_name”)
Example: Let’s understand this by implementing an example given below:
# code goes from here
#import pandas
import pandas as pd


df1 = pd.read_csv("solarSystem.csv")
df2 = pd.read_csv("PlanetRadius.csv")


new_data = pd.merge(df1, df2, on="planet")
print(new_data)
Output:
planet      	mass(kg)  ...  maximum distance(10^6m)  radius(km)
0      sun  	1.99 * 10^10  ...                   0.0         	NaN
1  mercury    3.3 * 10^3  ...                     	70.0      	2439.7
2    venus      4.9*10^4  ...                    	108.9     	6051.8
3    earth       6* 10^4  ...                    	152.1      	6371.0
4     mars      6.4*10^3  ...                    	249.0      	3389.5
5  jupiter      1.9*10^7  ...                    	817.0     	69911.0
6   saturn      5.7*10^6  ...                   	1500.0     	58232.0
7   uranus      8.7*10^5  ...                   	3000.0     	25362.0
8  neptune     1.02*10^6  ...                   	4540.0     	24622.0


[9 rows x 5 columns]
6. Command to join DataFrames
You can combine two data frames by joining the index into a single dataFrame. This command is similar to the merge command, but there is one difference. The difference is that the join command is on the index and the merge command is on the column.
We write this command as:
dataframe_1.join(dataframe_2)
Example: Let’s understand this by implementing an example given below:
#code goes from here
import pandas as pd
import numpy as np
df1 = pd.read_csv("solarSystem.csv")
radius = pd.DataFrame([np.nan, 2439.7, 6051.8, np.nan, 3389.5, 69911, np.nan, 25362, 24622])


df1 = df1.join(radius)
print(df1)
Output:
    planet      mass(kg)  ...  maximum distance(10^6m)   radius
0      sun  	1.99 * 10^10  ...                   0.0      	NaN
1  mercury    	3.3 * 10^3  ...                     	70.0   		2439.7
2    venus      	4.9*10^4  ...                    	108.9   	6051.8
3    earth       	6* 10^4  ...                    	152.1      	NaN
4     mars      	6.4*10^3  ...                    	249.0   	3389.5
5  jupiter      	1.9*10^7  ...                    	817.0  		69911.0
6   saturn      	5.7*10^6  ...                   	1500.0      	NaN
7   uranus      	8.7*10^5  ...                   	3000.0  	25362.0
8  neptune     	1.02*10^6  ...                   	4540.0  	24622.0


[9 rows x 5 columns]
We can use this join command for left, right, inner, or outer join the DataFrames.
To right-join with two other DataFrames, we write commands as:
dataframe_1.join(dataframe_2,how=’right’)
7. Command to Concatenate DataFrames
In this, The DataFrames can be concatenated together. The dimension on which you want to concatenate can be chosen.
We write this command as:
pd.concat([dataframe_1,dataframe_2])
Example: Let’s understand this by implementing an example given below:
# code  goes from here
import pandas as pd
df = pd.read_csv("solarSystem.csv")


pluto = pd.DataFrame([['pluto', '1.3 * 10^22']], columns=["planet", "mass(kg)"])


new_df = pd.concat([df, pluto])
print(new_df)
Output:
    planet      mass(kg)       distance from sun(10^6 m)  maximum distance(10^6m)
0      sun  	1.99 * 10^10             0.0                      	0.0
1  mercury    	3.3 * 10^3        	57.9                     	70.0
2    venus      	4.9*10^4                 	108.0                    	108.9
3    earth       	6* 10^4                  	150.0                    	152.1
4     mars      	6.4*10^3                  	228.0                    	249.0
5  jupiter      	1.9*10^7                  	779.0                    	817.0
6   saturn      	5.7*10^6                  	1433.0                   	1500.0
7   uranus      	8.7*10^5                  	2867.0                   	3000.0
8  neptune     	1.02*10^6                	        4500.0                   	4540.0
0    pluto   	1.3 * 10^22              	         NaN                      	NaN
8. Info Command
The non-null values for each column, the index dtype and columns, and the total
The DataFrame's memory usage is all printed out by using this command.
We write this command as:
Dataframe.info()
Example: Let’s understand this by implementing an example given below:
# code goes from here
import pandas as pd
df = pd.read_csv("solarSystem.csv")
print(df.info())
Output:
<class 'pandas.core.frame.DataFrame'>
RangeIndex: 9 entries, 0 to 8
Data columns (total 4 columns):
 #   Column                Non-Null Count  	Dtype
---  ------                     		-------------- 	 -----
 0   planet                     9 non-null      object
 1   mass(kg)                   9 non-null      object
 2   distance from sun(10^6 m) 	 9 non-null      float64
 3   maximum distance(10^6m)   	 9 non-null      float64
dtypes: float64(2), object(2)
memory usage: 416.0+ bytes
None
9. Describe Command
The summary information in descriptive statistics, which excludes null values for the numerical column, comprises the central tendency, minimum and maximum values, and the shape of a dataset's distribution. For category columns, summary information like count, frequency, etc.
It provides us with a DataFrame's summary statistic.
We write this command as:
Dataframe.describe()
Example: Let’s understand this by implementing an example given below:
# code goes from here
import pandas as pd
df = pd.read_csv("solarSystem.csv")
print(df.describe())
Output:
               distance from sun(10^6 m)  	maximum distance(10^6m)
count          	9.000000                 	9.000000
mean            1124.766667              	1159.666667
std             1574.548305              	1601.856057
min             0.000000                 	0.000000
25%             108.000000               	108.900000
50%             228.000000               	249.000000
75%             1433.000000              	1500.000000
max             4500.000000              	4540.000000
10. Replace Command in Pandas
The replace command in pandas changes the values of specified rows.
We write this command as:
#use the inplace keyword and set its value to True for a permanent replacement.
DataFrame.replace([value_1, value_2], numpy.nan, inplace=True)
Example: Let’s understand this by implementing an example given below:
# code goes from here
import pandas as pd
import numpy as np
df1 = pd.read_csv("solarSystem.csv")
print("before replacing \n")
print(df1)
df1.replace([228, 1433], np.nan, inplace=True)
print("\nafter replacing\n")
print(df1)
Output:
before replacing


    planet      mass(kg)         distance from sun(10^6 m)  maximum distance(10^6m)
0      sun  	1.99 * 10^10            	0.0                      		0.0
1  mercury    	3.3 * 10^3                	57.9                     		70.0
2    venus      	4.9*10^4                  	108.0                    		108.9
3    earth       	6* 10^4                    	150.0                    		152.1
4     mars      	6.4*10^3                  	228.0                    		249.0
5  jupiter      	1.9*10^7                  	779.0                    		817.0
6   saturn      	5.7*10^6                  	1433.0                   		1500.0
7   uranus      	8.7*10^5                  	2867.0                   		3000.0
8  neptune     	1.02*10^6                	4500.0                   		4540.0


after replacing


    planet      mass(kg)         distance from sun(10^6 m)  maximum distance(10^6m)
0      sun  	1.99 * 10^10         	0.0                      		0.0
1  mercury    	3.3 * 10^3                	57.9                     		70.0
2    venus      	4.9*10^4                  	108.0                    		108.9
3    earth       	6* 10^4                    	150.0                    		152.1
4     mars      	6.4*10^3                  	NaN                    		249.0
5  jupiter      	1.9*10^7                  	779.0                    		817.0
6   saturn      	5.7*10^6                  	NaN                   		1500.0
7   uranus      	8.7*10^5                  	2867.0                   		3000.0
8  neptune     	1.02*10^6                	4500.0                   		4540.0
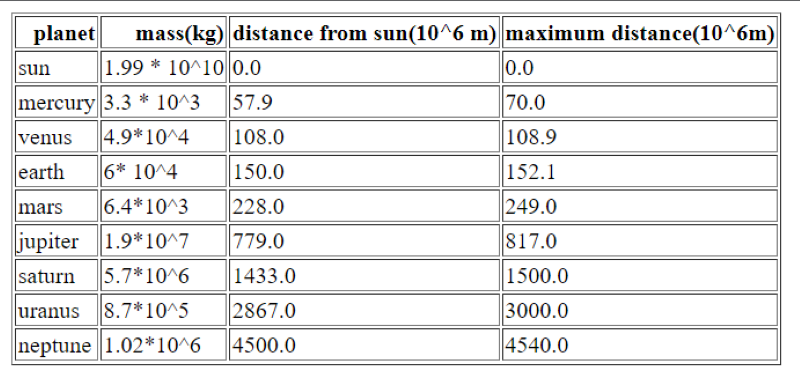
11. Data Munging in Pandas
In this, we can change the format of a specific piece of data. We can convert this command “.csv file” into “.html file”.
Example: Let’s understand this by implementing an example given below:
# code goes from here
import pandas as pd


df = pd.read_csv("solarSystem.csv")
df.to_html("solarSystem.html", index=False)
Output:
12. Command to find Mean, Median and Mode
Using this command, we can find the mean, median and mode of each data frame's table column.
If we want to find the mean of each column, then write the command as:
Dataframe.mean()
If we want to find the median of each column, then write the command as:
Dataframe.median()
If we want to find the mode of each column, then write the command as:
Dataframe.mode()
Example: Let’s understand this by implementing an example given below:
# code goes from here
import pandas as pd


df = pd.read_csv("solarSystem.csv")
mean_distance = df["distance from sun(10^6 m)"].mean()
median_of_distance = df["distance from sun(10^6 m)"].median()
mode_of_distance = df["distance from sun(10^6 m)"].mode()
print(
    f'''
mean of the distance from the sun:
{mean_distance}


median of the distance from the sun:
{median_of_distance}


mode of the distance from the sun:
{mode_of_distance}
'''
)
Output:
mean of the distance from the sun:
1124.7666666666667


median of the distance from the sun:
228.0


mode of the distance from the sun:
0       0.0
1      57.9
2     108.0
3     150.0
4     228.0
5     779.0
6    1433.0
7    2867.0
8    4500.0
Name: distance from sun(10^6 m), dtype: float64
13. Isnull command in Pandas
This command flags all rows with null values as True and produces a Boolean value.
We write this command as:
Dataframe.isnull()
Example: Let’s understand this by implementing an example given below:
# code goes from here
import pandas as pd


df = pd.read_csv("PlanetRadius.csv")
print(df.isnull())
Output:
	planet  	radius(km)
0   	False        	True
1   	False       	False
2   	False       	False
3   	False       	False
4   	False       	False
5   	False       	False
6   	False       	False
7   	False       	False
8   	False       	False
14. Fillna command in Pandas
With the help of this command, we can fill blank rows with a certain value.
A dataset's Nan rows can all be filled with the mean value.
We write this command as:
DataFrame.fillna(df.mean(), inplace = True)
You can also apply it to columns.
We write this command for the column as:
DataFrame['column_name'].fillna(df[column_name].mean(), inplace = True)
Example: Let’s understand this by implementing an example given below:
import pandas as pd


df = pd.read_csv("PlanetRadius.csv")
print("before updating\n")
print(df)
df["radius(km)"] = df["radius(km)"].fillna("unknown")
print("\nafter updating\n")
print(df)
Output:
before updating


    	planet  	radius(km)
0      	sun         	NaN
1  	mercury     	2439.7
2    	venus      	6051.8
3    	earth      	6371.0
4     	mars      	3389.5
5  	jupiter     	69911.0
6   	saturn     	58232.0
7   	uranus     	25362.0
8  	neptune     	24622.0


after updating


    	planet 		radius(km)
0      	sun    		unknown
1  	mercury     	2439.7
2    	venus     	6051.8
3    	earth     	6371.0
4    	mars     	3389.5
5  	jupiter    	69911.0
6   	saturn    	58232.0
7   	uranus    	25362.0
8  	neptune    	24622.0
15. Head command in Pandas
The data frame's first n rows will be returned by using this command.
We write this command as:
Dataframe.head()
Example: Let’s understand this by implementing an example given below:
# code goes from here
import pandas as pd


df = pd.read_csv("solarSystem.csv")
print(df.head())
Output:
    planet      mass(kg)         distance from sun(10^6 m)  maximum distance(10^6m)
0      sun  	1.99 * 10^10         	 0.0                      		0.0
1  mercury    	3.3 * 10^3                	57.9                     		70.0
2    venus      	4.9*10^4                  	108.0                    		108.9
3    earth       	6* 10^4                    	150.0                    		152.1
4     mars      	6.4*10^3                  	228.0                    		249.0
16. Tail command in Pandas
The data frame's last n rows will be returned by using this command.
We write this command as:
Dataframe.tail()
Example: Let’s understand this by implementing an example given below:
# code goes from here
import pandas as pd


df = pd.read_csv("solarSystem.csv")
print(df.tail())
Output:
    planet     mass(kg)       distance from sun(10^6 m)  maximum distance(10^6m)
4     mars   6.4*10^3                      228.0                    	249.0
5  jupiter   1.9*10^7                      779.0                    	817.0
6   saturn   5.7*10^6                     1433.0                   	1500.0
7   uranus  8.7*10^5                     2867.0                   	3000.0
8  neptune 1.02*10^6                   4500.0                   	4540.0
17. Shape command in Pandas
The total number of rows and columns will be returned as a tuple. This means that it is examining the data frame's shape.
We write this command as:
Dataframe.shape
Example: Let’s understand this by implementing an example given below:
#code goes from here
#import pandas
import pandas as pd
#reads .csv file
df = pd.read_csv("solarSystem.csv")


#It prints rows and columns in a data frame
print(df.shape)
Output:
(9, 4)
This output shows 9 rows and 4 columns in the given data frame.
18. Insert command in Pandas
To include a new column in a DataFrame, we can use the insert() command in Pandas. It accepts the column name, a list of the column's values and location, and a column index as its three keywords.
We write this command as:
DataFrame.insert(column = 'define_name', value = [], loc=0)
Example: Let’s understand this by implementing an example given below:
# code goes from here
import pandas as pd
import numpy as np


df = pd.read_csv("solarSystem.csv")
radius = [np.nan, 2439.7, 6051.8, 6371.0, 3389.5, 69911, 58232, 25362, 24622]
df.insert(column="radius", value=radius, loc=1)
print(df)
Output:
    planet   	radius  ... distance from sun(10^6 m)  maximum distance(10^6m)
0      sun      	NaN  ...                   	0.0                      	0.0
1  mercury   	2439.7  ...                 	57.9                     	70.0
2    venus   	6051.8  ...                 	108.0                    	108.9
3    earth   	6371.0  ...                 	150.0                    	152.1
4     mars   	3389.5  ...                 	228.0                    	249.0
5  jupiter  	69911.0  ...               	779.0                    	817.0
6   saturn  	58232.0  ...               	1433.0                   	1500.0
7   uranus  	25362.0  ...               	2867.0                   	3000.0
8  neptune  	24622.0  ...               	4500.0                   	4540.0


[9 rows x 5 columns]
19. Sub-command in Pandas
The sub() command allows us to subtract a specific number from each value in the Data frame. It operates on each item in a Data frame by iterating through it.
We write this command as:
DataFrame['column'].sub()
Here, in the sub() command, we can write any number we want to subtract from the column numbers in the Data frame.
Example: Let’s understand this by implementing an example given below:
#code goes from here
#import pandas
import pandas as pd


df = pd.read_csv("PlanetRadius.csv")
print("before updating\n")
print(df)


#print after subtracting 20 from the given column


df["radius(km)"] = df["radius(km)"].sub(20)
print("\nafter updating\n")
print(df)
Output:
before updating


    planet  radius(km)
0      sun         NaN
1  mercury      2439.7
2    venus      6051.8
3    earth      6371.0
4     mars      3389.5
5  jupiter     69911.0
6   saturn     58232.0
7   uranus     25362.0
8  neptune     24622.0


after updating


    planet  radius(km)
0      sun         NaN
1  mercury      2419.7
2    venus      6031.8
3    earth      6351.0
4     mars      3369.5
5  jupiter     69891.0
6   saturn     58212.0
7   uranus     25342.0
8  neptune     24602.0
In the above example, we subtract 20 from the radius (km) column and print a new data frame after subtracting.
20. Add command in Pandas
The add() command allows us to add a specific number with each value in the Data frame. It operates on each item in a Data frame by iterating through it.
We write this command as:
DataFrame['column'].add()
Here, in the add() command, we can write any number we want to add with the column numbers in the Data frame.
Example: Let’s understand this by implementing an example given below:
#code goes from here
#import pandas
import pandas as pd

df = pd.read_csv("PlanetRadius.csv")
print("before updating\n")
print(df)

#print after adding 20 from the given column

df["radius(km)"] = df["radius(km)"].add(20)
print("\nafter updating\n")
print(df)
Output:
before updating


    planet  radius(km)
0      sun         NaN
1  mercury      2439.7
2    venus      6051.8
3    earth      6371.0
4     mars      3389.5
5  jupiter     69911.0
6   saturn     58232.0
7   uranus     25362.0
8  neptune     24622.0


after updating


    planet  radius(km)
0      sun         NaN
1  mercury      2459.7
2    venus      6071.8
3    earth      6391.0
4     mars      3409.5
5  jupiter     69931.0
6   saturn     58252.0
7   uranus     25382.0
8  neptune     24642.0
In the above example, we add 20 from the radius(km) column and print a new data frame after adding.
21. Mul command in Pandas
The mul() command allows us to multiply a specific number from each value in the Data frame. It operates on each item in a Data frame by iterating through it.
We write this command as:
DataFrame['column'].mul()
Here, in the mul() command, we can write any number we want to multiply from the column numbers in the Data frame.
Example: Let’s understand this by implementing an example given below:
#code goes from here
#import pandas
import pandas as pd

df = pd.read_csv("PlanetRadius.csv")
print("before updating\n")
print(df)

#print after multiplying 20 from the given column

df["radius(km)"] = df["radius(km)"].mul(20)
print("\nafter updating\n")
print(df)
Output:
before updating


    planet  radius(km)
0      sun         NaN
1  mercury      2439.7
2    venus      6051.8
3    earth      6371.0
4     mars      3389.5
5  jupiter     69911.0
6   saturn     58232.0
7   uranus     25362.0
8  neptune     24622.0


after updating


    planet  radius(km)
0      sun         NaN
1  mercury     48794.0
2    venus    121036.0
3    earth    127420.0
4     mars     67790.0
5  jupiter   1398220.0
6   saturn   1164640.0
7   uranus    507240.0
8  neptune    492440.0
In the above example, we multiply 20 from the radius (km) column and print a
new data frame after multiplying.
22. Div command in Pandas
The div() command allows us to divide a specific number from each value in the
Data frame. It operates on each item in a Data frame by iterating through it.
We write this command as:
DataFrame['column'].div()
Here, in the div() command, we can write any number we want to divide from the column numbers in the Data frame.
Example: Let’s understand this by implementing an example given below:
#code goes from here
#import pandas
import pandas as pd

df = pd.read_csv("PlanetRadius.csv")
print("before updating\n")
print(df)

#print after dividing 20 from the given column

df["radius(km)"] = df["radius(km)"].div(20)
print("\nafter updating\n")
print(df)
Output:
before updating


    planet  radius(km)
0      sun         NaN
1  mercury      2439.7
2    venus      6051.8
3    earth      6371.0
4     mars      3389.5
5  jupiter     69911.0
6   saturn     58232.0
7   uranus     25362.0
8  neptune     24622.0


after updating


    planet  radius(km)
0      sun         NaN
1  mercury     121.985
2    venus     302.590
3    earth     318.550
4     mars     169.475
5  Jupiter    3495.550
6   Saturn    2911.600
7   Uranus    1268.100
8  Neptune    1231.100
In the above example, we divide 20 from the radius (km) column and print a new data frame after the divide.
23. Count command in Pandas
This command returned the total number of items in each column.
We write this command as:
DataFrame.count()
Example: Let’s understand this by implementing an example given below:
#code goes from here
import pandas as pd
df = pd.read_csv("PlanetRadius.csv")
#prints count of total number of items in column
print(df.count())
Output:
planet        9
radius(km)    8
dtype: int64
In the above example, the count() command prints the total number of items in the PlanetRadius data frame.
24. Series.std() command in Pandas
You can also determine the standard deviation for each column in a DataFrame using pandas' std() command. It operates by computing the standard deviation for each column in a dataset iteratively.
We write this command as:
DataFrame.std()
Example: Let’s understand this by implementing an example given below:
# code goes from here
import pandas as pd


df = pd.read_csv("PlanetRadius.csv")


sd = df["radius(km)"].std()
print(sd)
Output:
26191.747578347215
In the above example,std() command prints the standard deviation of radius(km) column.
25. Sort_values command in Pandas
This command allows us to sort values, ascending or descending, according to a certain column.
We write this command as:
new_DataFrame = DataFrame.sort_values(by = "colmun", descending = True)
Example: Let’s understand this by implementing an example given below:
import pandas as pd


df = pd.read_csv("PlanetRadius.csv")


new_df = df.sort_values("radius(km)")
print(f'''before updating
{df}


after updating
{new_df}
''')
Output:
before updating
    planet  radius(km)
0      sun         NaN
1  mercury      2439.7
2    venus      6051.8
3    earth      6371.0
4     mars      3389.5
5  jupiter     69911.0
6   saturn     58232.0
7   uranus     25362.0
8  neptune     24622.0


after updating
    planet  radius(km)
1  mercury      2439.7
4     mars      3389.5
2    venus      6051.8
3    earth      6371.0
8  neptune     24622.0
7   uranus     25362.0
6   saturn     58232.0
5  jupiter     69911.0
0      sun         NaN
In the above example, we sort the values of the radius(km) column in the PlanetRadius.csv data frame with the sort_values() command.
26. Where command in Pandas
A pandas query that accepts a predicate to get certain values in a column is where() command.
We write this command as:
DataFrame.where(DataFrame['Column_name'] < ‘number’)
In number, we can enter any number we must find from this.
Example: Let’s understand this by implementing an example given below:
#code goes from here
import pandas as pd


df = pd.read_csv("PlanetRadius.csv")
#findout values less than 4000 in radius(km)column
new_df=df.where(df["radius(km)"] < 4000)


#print dataframe before using where command
print(f'''before updating
{df}
#print data frame after using where command
after updating
{new_df}
''')
Output:
     before updating
    planet  radius(km)
0      sun         NaN
1  mercury      2439.7
2    venus      6051.8
3    earth      6371.0
4     mars      3389.5
5  jupiter     69911.0
6   saturn     58232.0
7   uranus     25362.0
8  neptune     24622.0


      after updating
    planet  radius(km)
0      NaN         NaN
1  mercury      2439.7
2      NaN         NaN
3      NaN         NaN
4     mars      3389.5
5      NaN         NaN
6      NaN         NaN
7      NaN         NaN
8      NaN         NaN
The above example prints values less than 4000 in the radius (km) column in the PlanetRadius.csv data frame using the where() command.
27. Query command in Pandas
We can call items using their index number with pandas' query() command.
For example, if we want to obtain the second row's item, then we write this command:DataFrame.query('3')
Example: Let’s understand this by implementing an example given below:
#code goes from here
	import pandas as pd
df = pd.read_csv("PlanetRadius.csv")
#print sixth row’s item
print(df.query('5'))
Output:
planet        jupiter
radius(km)    69911.0
Name: 5, dtype: object
In the above example, it prints the sixth row’s item in the PlanetRadius.csv data frame by using the query() command.
28. melt command in Pandas
The pandas' melt() command changes a DataFrame's columns to individual rows.
It involves revealing a DataFrame's internal structure. As a result, it enables you to explicitly inspect the value assigned to each column.
We write this command as:
new_DataFrame = DataFrame.melt()
Example: Let’s understand this by implementing an example given below:
#code goes from here
import pandas as pd
df = pd.read_csv("PlanetRadius.csv")
new_df=df.melt()
#print new data frame after using melt() command
print(new_df)
Output:
      variable    value
0       planet      sun
1       planet  mercury
2       planet    venus
3       planet    earth
4       planet     mars
5       planet  jupiter
6       planet   saturn
7       planet   uranus
8       planet  neptune
9   radius(km)      NaN
10  radius(km)   2439.7
11  radius(km)   6051.8
12  radius(km)   6371.0
13  radius(km)   3389.5
14  radius(km)  69911.0
15  radius(km)  58232.0
16  radius(km)  25362.0
17  radius(km)  24622.0
In the above example, we convert DataFrame's columns to individual rows and print new dataFrame after using the melt() command.
29. Corr command in Pandas
Do you need to determine whether float or integer columns are correlated? You
Can accomplish it with the use of pandas' the corr() command:
We write this command as:
DataFrame.corr()
The above code generates a new DataFrame with the correlation order for each integer or floats column using the corr() command in Pandas.
30. Drop command in Pandas
In a DataFrame, pandas' drop() command deletes particular rows or columns. You need to provide the axis, row index, and column names to use it.
We write this command as:
DataFrame.drop()
Example: Let’s understand this by implementing an example given below:
#code goes from here
import pandas as pd
df = pd.read_csv("solarSystem.csv")
print("Before using the drop command\n")
print(df)
new_df=df.drop(columns=['planet', 'mass(kg)'], axis=0)
print("\nAfter using the drop command\n")
print(new_df)
Output:
Before using the drop command


    planet      mass(kg)  distance from sun(10^6 m)  maximum distance(10^6m)
0      sun  1.99 * 10^10                        0.0                      0.0
1  mercury    3.3 * 10^3                       57.9                     70.0
2    venus      4.9*10^4                      108.0                    108.9
3    earth       6* 10^4                      150.0                    152.1
4     mars      6.4*10^3                      228.0                    249.0
5  jupiter      1.9*10^7                      779.0                    817.0
6   saturn      5.7*10^6                     1433.0                   1500.0
7   uranus      8.7*10^5                     2867.0                   3000.0
8  neptune     1.02*10^6                     4500.0                   4540.0


After using the drop command


distance from sun(10^6 m)  maximum distance(10^6m)
0                        0.0                      0.0
1                       57.9                     70.0
2                      108.0                    108.9
3                      150.0                    152.1
4                      228.0                    249.0
5                      779.0                    817.0
6                     1433.0                   1500.0
7                     2867.0                   3000.0
8                     4500.0                   4540.0
In the above example, we delete the planet and mass (kg) column using the drop() command and print a new DataFrame after deleting.