Clustering in R Programming
The clustering technique is an unsupervised machine learning in R programming. Before discussing clustering techniques, let's have a look at what unsupervised machine learning is?
Unsupervised learning is training the model with unlabeled data. So, we train the model with raw data, but we don't label the data, i.e., we don't classify the type of data.
For example, we have a basket filled with fruits containing cheery, strawberries, apples, and plums. As it is an unsupervised learning model, we will not label the fruits with their respective name.
In layman's words, Clustering is nothing but dividing the data into various groups so that each group contains the feature of a similar type of data point. A data point is the unit of observation of our dataset.
In the above example, the model has segmented the fruit dataset into 4 clusters depending on the features of each fruit. The Clustering technique is used to find similar datasets during the process of data mining and data analysis.
Application of Clustering in R Programming:
a) Marketing:
- The clustering technique explores and segregates customers who can be our product's potential buyers.
b) Retail:
- The clustering technique is used in retail industries to segregate customers based on their style, choice, and preferences. Hence, this will allow them to manage their store very efficiently.
c) Games:
- The clustering algorithm is used to suggest the games to the users based on their area of interest.
d) Internet:
- Every user has a different field of interest. Based on browsing history, we can segregate users by using a clustering algorithm.
e) Medical Science:
- The clustering algorithm is used to discover new medicines or treat patients.
f) Sociology:
- It divides people based on their lifestyles, demographics, socioeconomic status, etc.
g) Stock Marketing:
- A clustering algorithm is even used in the stock market. It is used to group the stocks based on their performances.
Methods of Clustering:
The clustering method can be further divided into 2 sections. They are as follows:
- Hard Clustering
- Soft Clustering
1. Hard Clustering:
- Data points belong to the cluster, or data points are assigned to one cluster only.
- An example of Hard Clustering is K-means clustering.
2. Soft Clustering:
- The probability of the data point is assigned in the cluster itself rather than putting each data point in one cluster.
- An example of Soft Clustering is Fuzzy Clustering.
K-means Clustering in R Programming:
K-means Clustering is the most popular partitioning algorithm among all Clustering techniques. It is an iterative hard clustering technique. K-means Clustering uses an unsupervised learning algorithm.
In this type of Clustering, the total number of clusters is pre-defined by the user. Clusters are formed based on the similarity of each data point from the dataset. K-means clustering finds out the centroid of the cluster.
Syntax of K-means Clustering:
kmeans(x, centers, nstart)


Description of the above parameters:


x – It represents a numeric matrix or data frame.
centers – It represents the k value
nstart – It represents several random sets that are supposed to be chosen.
K-means Algorithm:
- The first step is to specify the number of clusters, i.e., k. k can be any positive integer.
- Let's consider the value of k as 2, and there are 5 data points.
- Now, we will randomly assign each data point to a cluster with their respective data points.
- Then, it will calculate the centroids.
- And in the next step, we will re-allocate each data point to its nearest cluster centroid.
- And at last cluster centroid is re-figured.
EXAMPLE:
CODE:
# K-MEANS CLUSTERING ALGORITHM IN R PROGRAMMING
# The first step is to import the iris dataset into our RStudio.
data <- read_csv("C:/Users/Dhruvi Patel/Documents/DATASETS/iris.csv")
print(data)
# head function will display the first 6 rows of our iris dataset.
head(data)
# This means are using only petal length and width columns from the dataset.
a=data[,3:4]
# head(a) will display the first 6 rows of petal length and width columns.
head(a)
# Now, we are using the k-means algorithm.
model=kmeans(a,3)
#installing cluster library.
library(cluster)
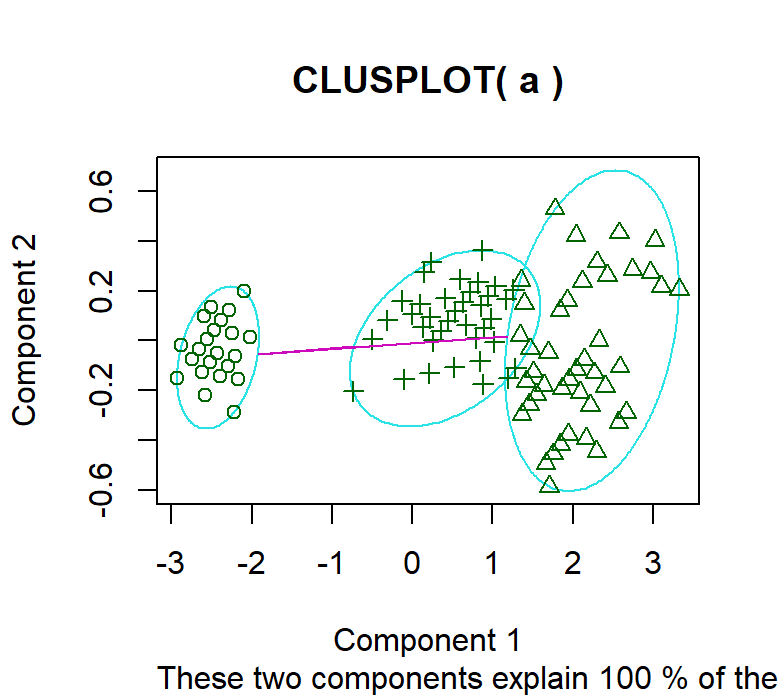
# clusplot function will create a 2-D graph of our cluster.
# OUTPUT 1
clusplot(a,model$cluster)
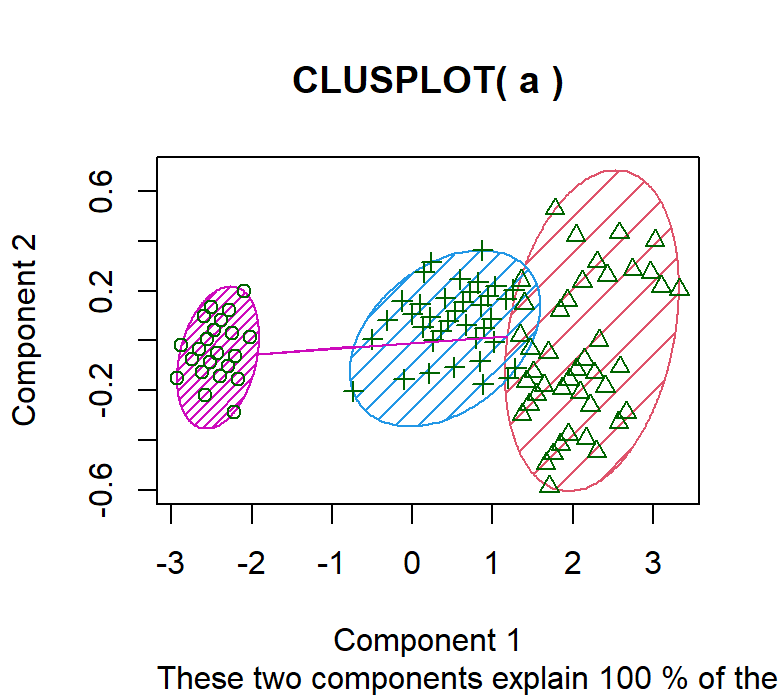
# OUTPUT 2
# Here, we are differentiating the clusters by shading them. So that we can identify different clusters.
clusplot(a,model$cluster,color=T,shade=T)
By executing the above code, we get the following results:
OUTPUT 1:
OUTPUT 2:
CONCLUSION:
This was all about clustering algorithms in R Programming.