Normal Distribution in R Programming
In statistics, the normal distribution is a type of probability function. Normal distribution tells the user about the distribution of data values in the dataset. It is a very important probability function among all other probability functions because of its advantages. Real case scenarios of the normal distribution are rolling dice, identifying the size of a shoe, the IQ level of any individual, the height of the population, etc.
In most cases, we can say that the data is normally distributed when the random collection of data is from independent sources. When you plot a normal distribution curve, you get a bell-shaped curve. We can say that the distribution of normal distribution is symmetric.
A Bell-shaped curve means that the peak of the graph represents the mean of our dataset. And the values of the graph are divided into 2 sections, half of the values on the left-hand side of the mean and half on the right-hand side of the mean.
The values are shaped properly and follow a continuous probability distribution all over the curve in the normal distribution. In most cases, all the data values are close to the center peak of the distribution.
There are 4 in-built functions provided in R to generate normal distribution. They are as follows:
dnorm(x, mean, sd)
pnorm(x, mean, sd)
qnorm(p, mean, sd)
rnorm(n, mean, sd)


Description of above parameters:
x = vector of numbers
p = vector of probabilities
n = number of observations
mean = mean value of our data(The default value of mean is 0)
sd = sd stands for standard deviation(The default value of sd is 1)
Let’s discuss all the in-built functions of normal distribution one by one.
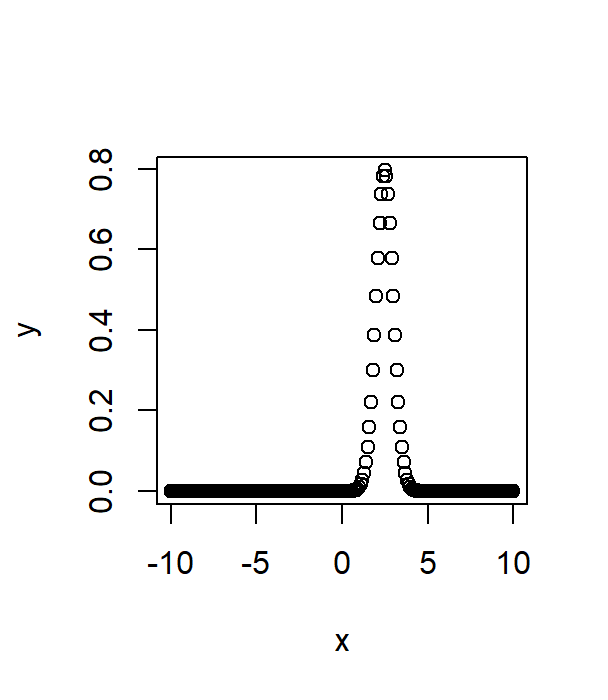
a) dnorm:
- dnorm is the distribution of data in terms of probability density.
- Syntax of dnorm is as follows:
In the below example, we are creating a sequence of numbers from -10 to10.
dnorm(x, mean, sd)


where,
x = vector of numbers
mean = mean value of our data
sd = standard deviation of our data
CODE:
# NORMAL DISTRIBUTION
# dnorm
# We are Creating a sequence of numbers between -10 and 10.
# And we are incrementing by 0.1.


x <- seq(-10, 10, by = .1)


# Choosing the mean as 2.5 and standard deviation as 0.5 in the
# above example


y <- dnorm(x, mean = 2.5, sd = 0.5)


# Plotting the normal distribution curve by using the plot() function.
plot(x,y)
OUTPUT:
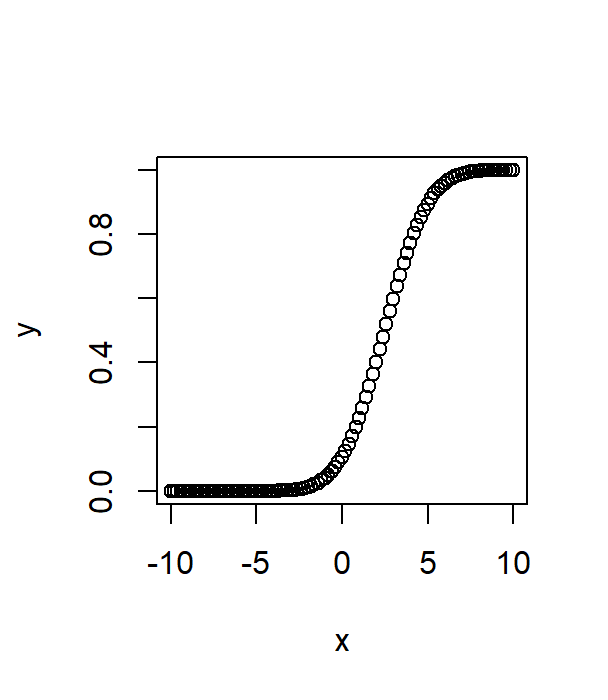
b) pnorm:
- pnorm is used to get the cumulative distribution in terms of the probability of the data values.
- Syntax of pnorm is as follows:
pnorm(x, mean, sd)


where,
x = vector of numbers
mean = mean value of our data
sd = standard deviation of our data
CODE:
# NORMAL DISTRIBUTION
# pnorm
# We are Creating a sequence of numbers between -10 and 10.
# And we are incrementing by 0.2.


x <- seq(-10,10,by = .2)


# Choosing the mean as 2.5 and standard deviation as 0.5 in the
# above example


y <- pnorm(x, mean = 2.5, sd = 2)


# Plotting the normal distribution curve of the pnorm() function.
plot(x,y)
OUTPUT:
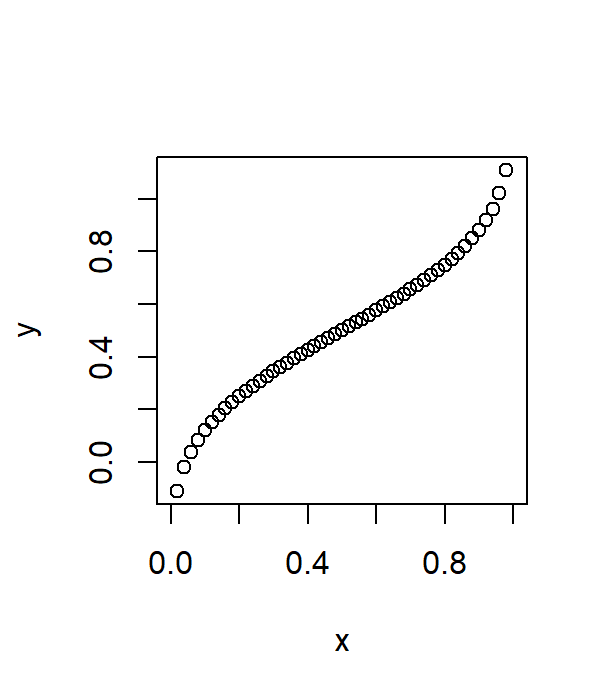
c) qnorm:
- qnorm() function takes the probability value, giving the output corresponding to its probability value.
- Syntax of qnorm() function is as follows:
qnorm(p, mean, sd)


where,
p = vector of probabilities
mean = mean value of our data(Default value of mean is 0)
sd = sd stands for standard deviation(The default value of sd is 1)
CODE:
# NORMAL DISTRIBUTION
# qnorm
# We are Creating a sequence of numbers between -10 and 10.
# And we are incrementing by 0.02.


# Here, we are creating a sequence of probability values
# And we are incrementing by 0.2.
x <- seq(0, 1, by = 0.02)


y <- qnorm(x, mean(x), sd(x))


# Plotting the normal distribution curve of the qnorm() function.
plot(x, y)
OUTPUT:
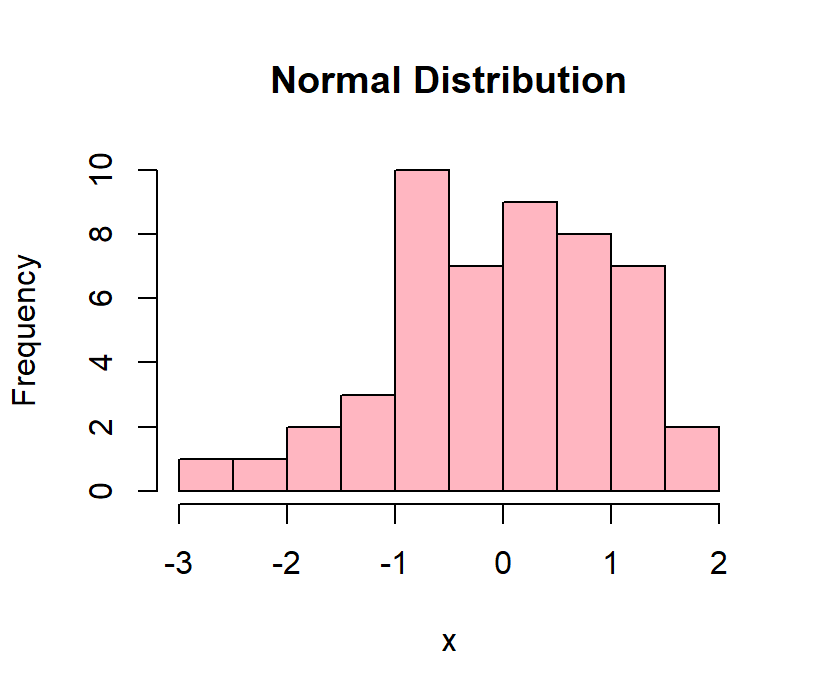
d) rnorm:
- rnorm() function will give us random numbers from our dataset with the specified mean and standard deviation, normally distributed in nature.
- Syntax of rnorm() is as follows:
rnorm(n, mean, sd)


where,
n = number of observations
mean = mean value of our data(the default value of mean is 0)
sd = sd stands for standard deviation(the default value of sd is 1)
CODE:
# NORMAL DISTRIBUTION
# rnorm
# we are plotting histogram in this example.
x <- rnorm(50)
hist(x, main = "Normal Distribution", col = "lightpink")
OUTPUT: