
R Switch Statement

It is an alternate way to a nested if…else statement. A switch statement permits an expression to be tested against a list of case values. In short, we can say that a switch statement is used to compare an expression to known values or number of cases.

Syntax:

switch(expression, case1, case2, case3....caseN)

First of all, it will enter the switch case statement which has an expression. Next, it will go to the case1 condition, checks the value passed to the condition. If it is true, the block of statements will execute. After that, it will break from the first switch case.

In case it is false, then it will go to the next case i.e. case2. If the case2 condition is true, it will execute the statement and then break from the case, else it will again switch to the next case.

In case of no match or there is some wrong input from the user, then it will go to the default case where it will print your statement of the default block.

Flow Chart:
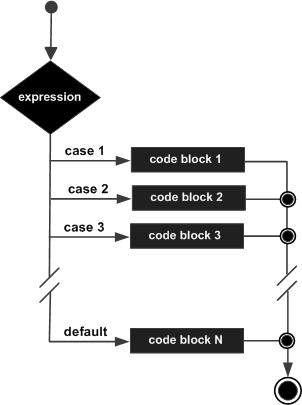
R Switch Statement                      

Example:

y = 3
x = switch(
  y,
  "Nikita",
  "Deep",
  "Nidhi",
  "Deepika"
)
print (x)

Output:

[1] "Nidhi"

Related Topics

R Data Types

Data types are used to define the size and type of the variable. In R, there is no need to declare a variable as some data types. The variables are...

4 minutes read.

R Excel Files

Microsoft Excel is the spreadsheet program which stores data in the .xls and .xlsx format. R has the facility to read directly from these files using some excel specific packages....

2 minutes read.

R Operators

A symbol that tells the compiler to perform specific mathematical or logical operations is called operator. R language supports mainly 5 different types of operators, which are listed below: Arithmetic...

3 minutes read.

Normal Distribution in R Programming

In statistics, the normal distribution is a type of probability function. Normal distribution tells the user about the distribution of data values in the dataset. It is a very important...

3 minutes read.

R Pie Charts

R programming language provides many numbers of libraries to create charts and graphs. A pie-chart is a representation of data as slices of a circle with different colors representing counts...

2 minutes read.

R Tutorial

Introduction to R Programming R is nothing but a programming language, also a free software environment. This software used for predictive analysis, statistical analysis, graphical representation, data modeling, and reporting. R...

9 minutes read.

Bubble Chart in R Programming

In this article, we will talk about another type of chart in R programming, i.e., the Bubble chart. A bubble chart is a type of data visualization chart that helps display multiple...

4 minutes read.

Clustering in R Programming

The clustering technique is an unsupervised machine learning in R programming. Before discussing clustering techniques, let's have a look at what unsupervised machine learning is?  Unsupervised learning is training the model with...

3 minutes read.

R Variables, Constants and Reserved Words

R Variables Variables are very similar to an open box, where you can put any value of your wish. We can change the values as well. Variables are used to store...

4 minutes read.

Introduction to R Programming

What is R Programming? R is a programming language which provides an environment for software used for statistical analysis, graphics representation and reporting. It possesses an extensive catalog of...

4 minutes read.

R Functions

In programming, a function is a group of instructions that you want to use repeatedly, because of their complexity, are better self-contained in sub-program and called when needed. Hence, we can...

4 minutes read.

How to create Histograms in R

R Histograms A Histogram is the graphical representation of the distribution of numeric data. It takes only one numeric variable as input. The variable is cut into several bars (also called...

2 minutes read.

Various types of Charts in R Programming

As we know, R Language is mostly used for analyzing the data and statistics purposes to represent our data graphically & pictorially in R studio. Charts and graphs are plotted in...

4 minutes read.

R Switch Statement

It is an alternate way to a nested if…else statement. A switch statement permits an expression to be tested against a list of case values. In short, we can say...

1 minute read.

Pie Charts in R Programming

R programming has various libraries to plot various types of charts and graphs. A pie chart is a circular statistical chart or graph, which is divided into slices to represent the numerical...

4 minutes read.

R Inheritance

One the main concept of object oriented programming is inheritance which allows us to define a new class of existing classes. This means that we can derive new classes from...

5 minutes read.

Linear Regression in R Programming

Linear Regression is an unsupervised machine learning algorithm in R programming. Linear Regression is a type of regression analysis that shows the relationship between two or more variables. And one...

3 minutes read.

R JSON File

JSON stands for JavaScript Object Notation. It is a lightweight format for storing and transporting data. JSON file is often used when data is sent from a server to a...

2 minutes read.

Analysis of Covariance in R Programming

Analysis of Covariance can also be named ANCOVA. We know that we use the concept of regression analysis for creating models which can explain the effect of the variation in...

2 minutes read.

R If Else Statement

If statement It is the most simple decision-making statement. It checks the condition if the condition is true then only it will execute the block of statements written in the ‘if...

2 minutes read.