Grafana Tutorial
Grafana Tutorial
Grafana is an open-source data visualization and analysis tool which allows us to view our data in the form of beautiful graphs.
What is Grafana?
- Grafana is an open-source data visualization and analysis tool designed by Torkel Odegaard in January 2014.
- It enables us to create a dashboard for collecting, processing, storing, and analyzing data from various different sources.
- It allows us to query, visualize, alert on, and understand our metrics without worrying about the location where it is stored on the memory.
- It includes a variety of visualization option that helps us to understand our data, beautifully.
- Grafana is written in Go and Node.js LTS language with a strong API (Application Programming Interface).
What is Grafana Dashboard?
Grafana Dashboard is used to pull data from various data sources such as Prometheus, Influx DB, Graphite, ElasticSearch, MySQL, PostgreSQL, CloudWatch, Microsoft SQL Server, and many more.
A Grafana Dashboard contains various visualization options such as heat maps, geo maps, histograms, tables, free text panels, and different types of charts & graphs to study and understand business data easily.
In Grafana, we create the following types of Grafana Dashboard:
- Dynamic Dashboard
- Production Dashboard
- VMware VMs
- Cisco switch RV 325 Dashboard
- MariaDB Dashboard
- Testing dynamic Dashboard
Why Grafana?
There are the following reasons to use Grafana –
1. Easy virtualization
Grafana provides the best virtualization technique by adding multiple graphs to a single visualization panel.
2. Drag and drop panels
Grafana uses drag and drop panels to insert images, videos, tables, and graphs on the Grafana dashboard.
3. Flexible to use
Grafana is flexible to use because it can combine with influx Data.
4. Support 30+ Data Sources
Grafana supports more than 30 data sources to bring our data together for a better context. Grafana mainly uses various databases like Azure Monitor, Elasticsearch, Loki, Microsoft SQL Server (MSSQL), OpenTSDB, and PostgreSQL. Grafana provides a customized query editor and specifies a syntax for each data source.
5. Open-source
Grafana is an open-source platform because we don’t need any license and pay any charge to use the Grafana platform.
6. Multi-platform support
Grafana supports multi-platform so that we can install Grafana in any platform like Windows, Linux, Mac, Docker container, and ARM.
History of Grafana
Before Grafana, most of the companies use the Kibana. Kibana helps us to build a dashboard by writing the JSON documents. The disadvantage of Kibana is that the editing panel was a little tricky.
To remove the issues related to Kibana, Grafana was introduced.
Grafana v1 (2014)
- Grafana v1 helps us to make editing easier.
- It provides a full-screen edit mode with the visible panel taking views and options.
- It also helps us to make queries easier and more understandable.
Grafana v2 (2015)
- Grafana v2 introduced the backend application, which was written in the Go programming language.
- It helps us to save the dashboard without using ElasticSearch.
- It contains a side menu with data source that we can add through the UI.
- It also allows us to go into a separate server admin section.
Grafana v3 & v4 (2016)
- Grafana v3 introduced the plugin system and also add official support for panel plugins.
- grafana.net was launched, which had a plugin and dashboard repository.
- Grafana v4 made some small style changes.
Grafana v5 (2018)
- Grafana v5 solves the problem related to rows (add and edit rows), by switching to a new grid system.
- It strongly focused on backward compatibility when we move to the dashboards and visualizations.
- Increase the security to ensure users that their dashboards and graphs are safe and remain the same.
Grafana v6 (2019)
- It enables us to switch virtualization without removing the panel.
- Grafana v6 mainly focused on UX work.
Features of Grafana
The most important features of Grafana are listed below:
1. Plugins Platform
Grafana provides an advanced platform to users for easier, faster, and most efficiently create new high-quality plugins.
2. Transformation
Transformation is the most important feature of Grafana that allows us to transform non-time series data into tables within seconds without any additional overhead.
3. Dynamic Dashboards
Grafana helps us to create a dynamic and reusable dashboard with good looking templates that appear at the top of the dashboard.
4. Authentication
Grafana supports authentication techniques like LDAP and Google Auth to map users to the organization.
5. Explore Metrics and Logs
In Grafana, we can explore our data metrics through ad-hoc queries. We can also split-view using different time range and data range.
6. Alerting
Grafana helps us to continuously evaluate and send alert notification to a number of different notifiers, including systems such as Slack, VictorOps, OPsGenie, SMS, email, and PagerDuty.
7. Annotations
Annotations are useful for correlating data if something went to wrong.
8. Mixed Data Sources
Grafana supports various storage backends for data sources such as AWS CloudWatch, Azure Monitor, Elasticsearch, Loki, Microsoft SQL Server (MSSQL), OpenTSDB, PostgreSQL, and Stackdrier.
9. Beautiful Dashboard
Grafana contains a well-designed dashboard with beautiful Graphs, Text, Alert messages, tables, clock, Logs, plugin lists, and more.
10. Big community
Grafana community has more than 600 developers all over the world. Its community includes large organizations such as VMware, Paypal, AWS, RedHat, and more.
Install Grafana on Windows
Grafana is the best data virtualization tool that uses a wide variety of data sources to visualize data in real-time. It is used by large organizations such as CERN, Digital Ocean, and Paypal.
We can install Grafana on Windows using the below steps –
Step 1: Go to any web browser, copy-paste the below link, or simply click on the below link.
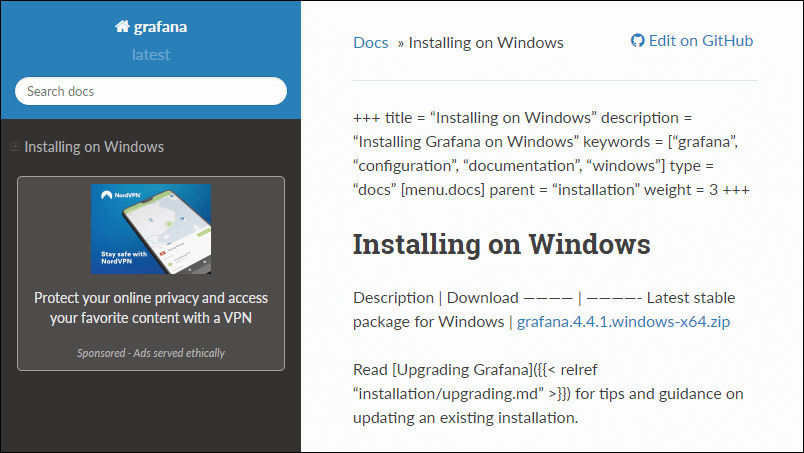
https://grafana.readthedocs.io/en/latest/sources/installation/windows.html
Step 2: Once the link is opened, the below window appears on the screen, in which click on the grafana.4.4.1.windows-x64.zip.
Step 3: Extract the downloaded file.
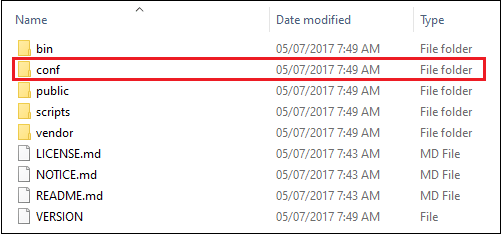
Step 4: Go to the file location where you extract the file and click on the grafana-4.4. Click on the conf as shown in the below screenshot.
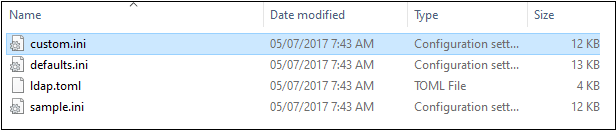
Step 5: The following options appear on the screen. Copy sample.ini and paste it in the same location, as shown in the screenshot.
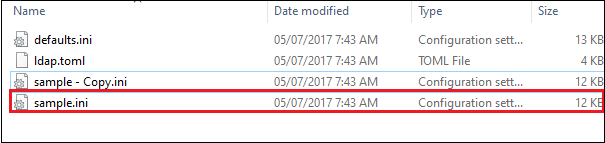
Step 6: Rename file sample – Copy.ini to custom.ini.
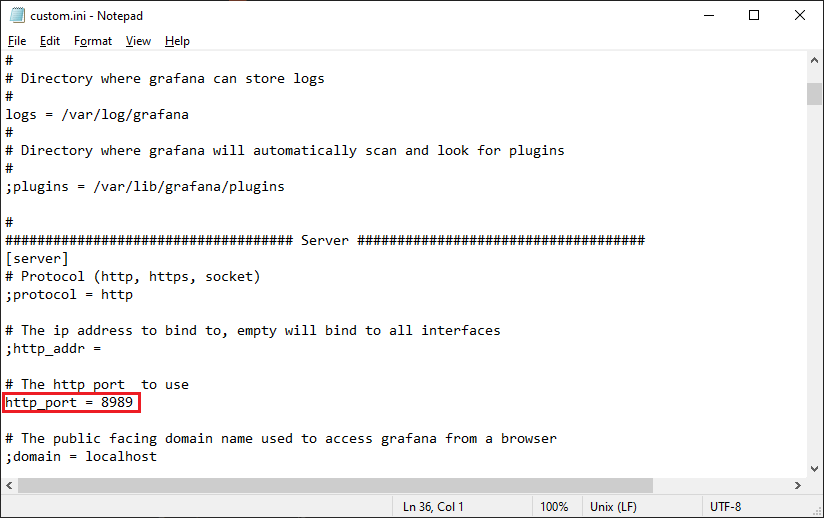
Step 7: Now, double click on the custom.ini, the following screen appears on the screen, in which you can change the Http port number by writing http_port = 8989 and save the file.
Note:
1. The default Grafana http_port is 3000.
2. Make sure you remove the semicolon (;) before the http_port = 8989.
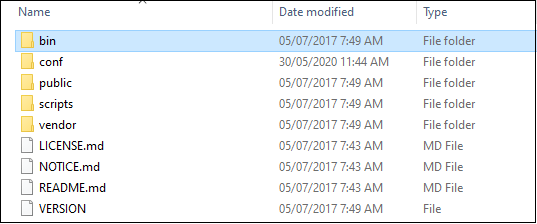
Step 8: Now again, go to the grafana – 4.4.1 folder and click on the bin.
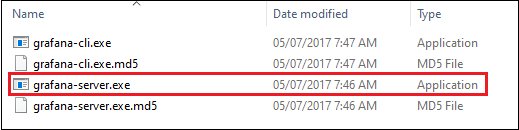
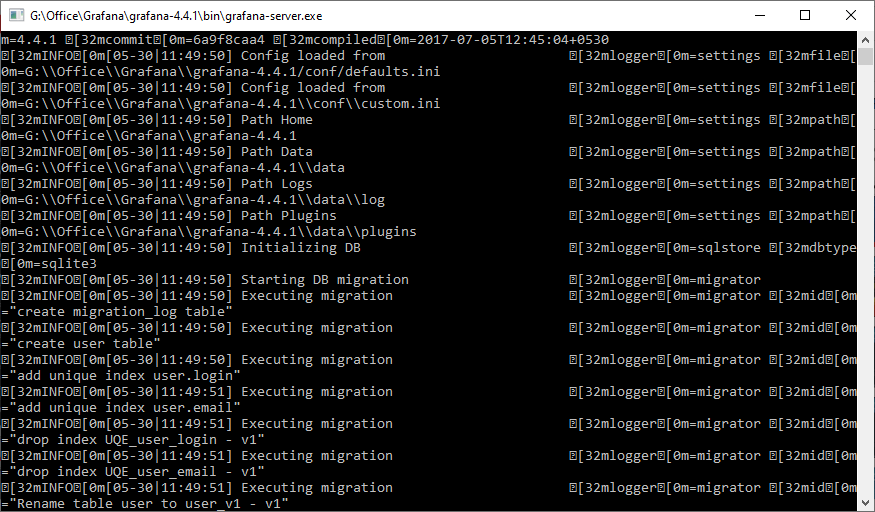
Step 9: The following screen appears on the screen, in which double click on the grafana-server.ese.
Step 10: Once you double click on the grafana-server.ese, the following window appears on the screen.
Step 11: Now, go to browser and type localhost:8989, the following window appears on the screen.
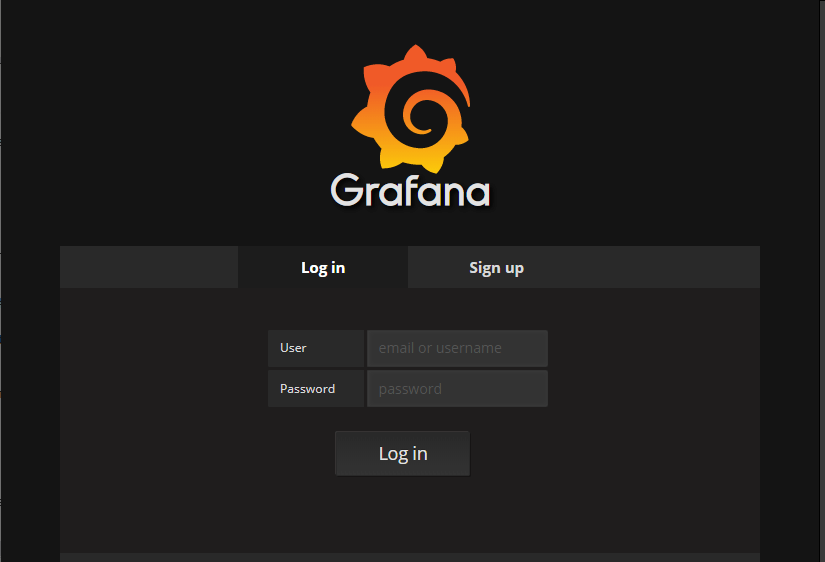
Note: 1. If you are unable to see the Grafana Login window, then type localhost: 3000 (default Grafana port) and press enter.
2. To resolve the post issue go to custom.ini and make sure you type http_port = 8989
Step 12: The default user and password is admin, so type user as admin and password as admin to Login.
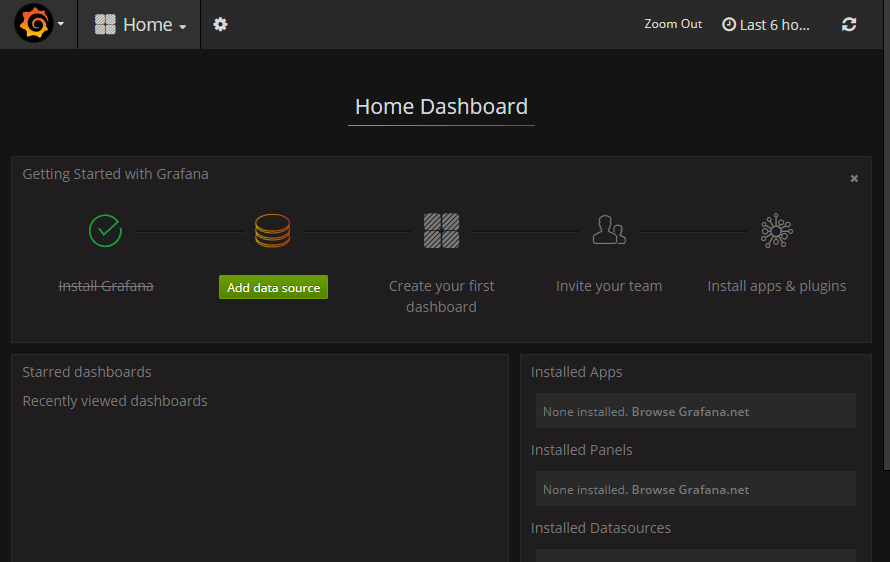
The below screenshot shows the Home Dashboard of grafana.
Integrate Grafana with MySQL
Grafana integration with MySQL helps us to get the MySQL data into Grafana and visualize it in the form of beautiful graphs.
To integrate Grafana with MySQL, first, we need to install the SQL and remember the following fields.
- IP address
- Username
- Password
Follow the below steps to integrate Grafana with MySQL:
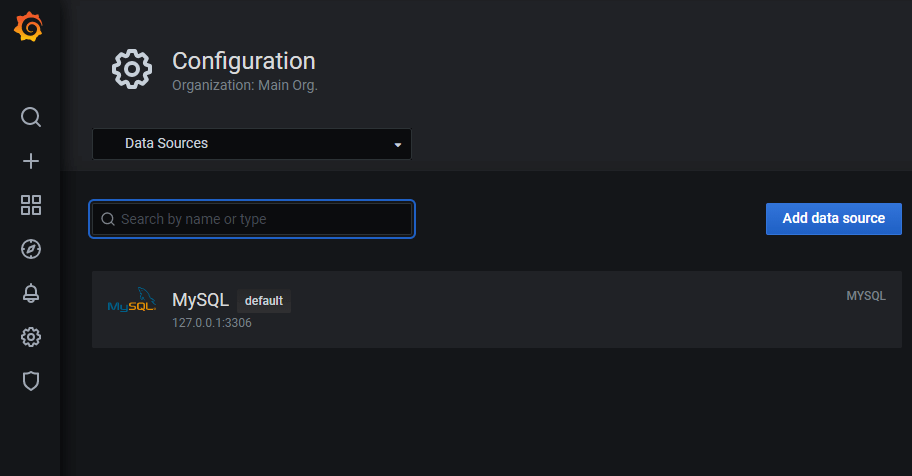
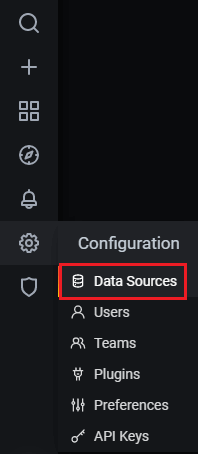
Step 1: Go to the Home page of Grafana Dashboard, click on the setting from the left panel and then select Data Sources.
Step 2: The following screen appears on the screen, in which select MySQL.
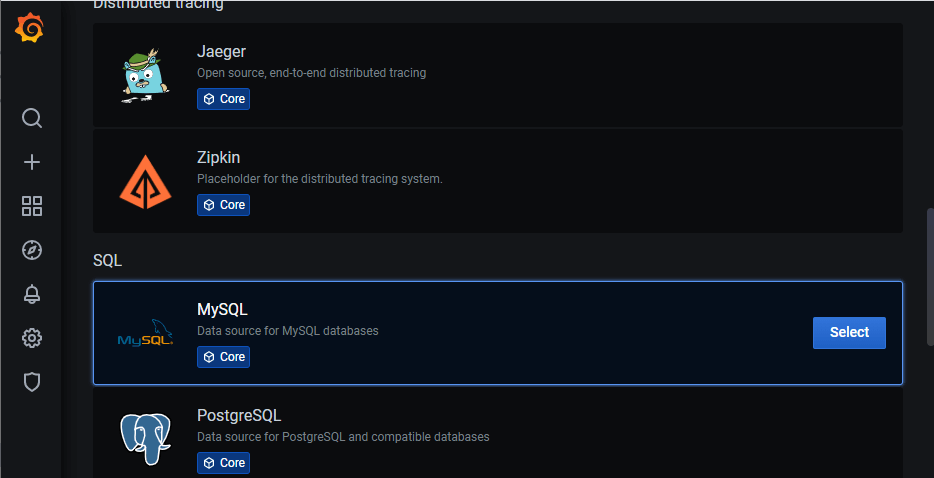
Step 3: Fill the information related to IP address, username, password, database type, and more then click on the Save & Test.
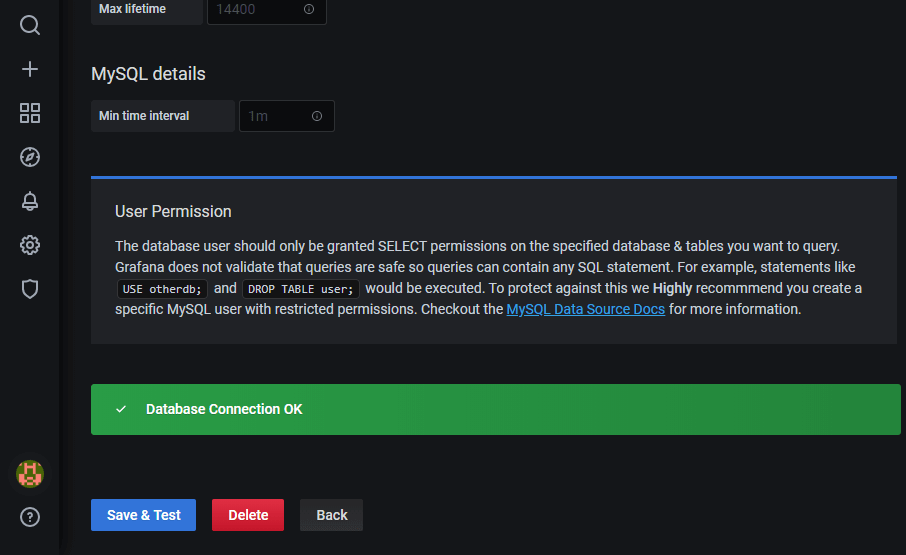
Step 4: Now, click on the setting -> Data Sources, you can see that MySQL is added in the data source.