What is Nagios?
Nagios is a
continuous monitoring tool. Nagios handles the entire IT infrastructure to ensure systems, applications, services, and business processes are working properly. It works inside a
DevOps culture. It is an
open-source monitoring system to monitor small to an enterprise computer network. You can monitor
servers, switches, applications, and
services by Nagios. Nagios notify whenever there is a problem, after resolving the problem Nagios sends a notification. You can receive a notification via
e-mail, SMS or
phone calls.
- A widely-used monitoring tool for troubleshooting.
- Alerts when things go bad and when they get better.
- Nagios runs under a Linux
- Nagios provides support to an administrator for detecting problems (mail server failure, hard drive overload, network outage) before uses.
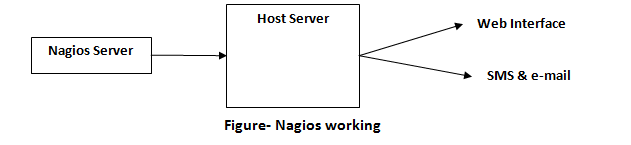
How does Nagios work?
Nagios runs on a server where the plug-in is installed and starts running automatically. They further contact the hosts/ server on your network and give the status message in two different manners. One is a
web interface and other is
SMS and
e-mail. Nagios works as a scheduler and runs selected scripts after a repeated time interval. When requirement changes, the previous script will be stored and new scripts will be run depending on needs.
In short, the working of Nagios is based on plug-ins that give the confirm status of server, application or infrastructure issues.
What is continuous monitoring?
Once the application becomes active, the role of continuous monitoring comes into existence. The process is all about taking care of company infrastructure and respond immediately as soon as error detects. The technique, static analysis that is responsible for detecting, responding or reporting the log but the analysis is not much accurate. But, with continuous monitoring, you can perform and respond to each of the activities in the best way.
The process is performed on the continuous (on-going) basis that reports instantly about the risks that can be faced by an organization for its poor infrastructure. You can check the activities of networks and data analytics report when required.
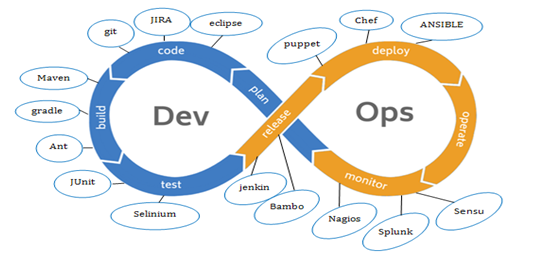
In the above figure, there is no end to a DevOps life cycle, and that is the reason for the infinity symbol. It is all about the ability of an organization to detect, report, respond, contain and mitigate the attack that occurs, in its infrastructure.
Why is continuous monitoring useful?
Continuous monitoring detects system error before they occur. Error impacts on business productivity. Following features explain why continuous monitoring is useful:
- It detects network errors and system crashes.
- Entire IT infrastructure and business process can be monitor in a single pass only.
- It monitors service availability and security.
- Issues can be fixed automatically as soon as they occur.
- Notification system to inform the administrator when something goes wrong.
- It determines the root causes of any problem.
Key Concept
- Colored are concept, green for ok, yellow for warning and red for critical
- No performance analysis or display
- Web interface and notifications
- Various possibilities for remote check
- Check using plugin
Features of Nagios
- Monitor server resources like a disk drive, memory, processor, etc.
- Monitor network services like SMTP, HTTP, SNMP, FTP, etc.
- You can setup Nagios in a distributed manner if you need to have a monitoring system in multiple locations.
- You can set it to send SMS, e-mail and even voice call whenever there is a problem in the network.
- Nagios installs a web portal where you can view current network status.
- Parallelized service checked.
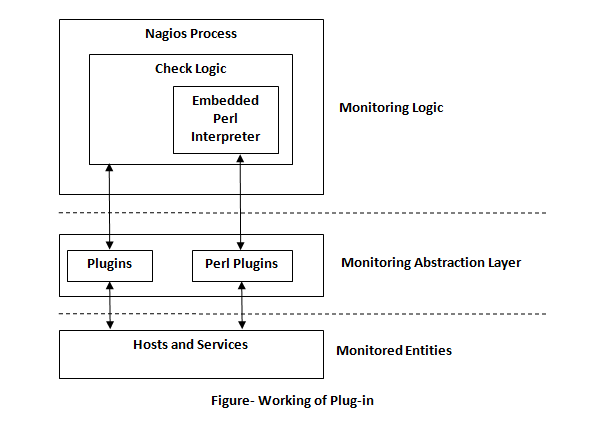
What are the Plugins?
A plugin is a small program that checks services. It returns a value and a small line of text. Plugin behaves as an abstraction layer between the monitoring logic present in the Nagios daemon and the actual services and hosts that are being monitored.
- Nagios plugins are standalone extensions.
- Plugins operate as standalone applications.
- Plugin process command line arguments.
- Return the result to Nagios core for further processing.
- A plugin can be compiled binaries (written in C, C++, etc.) or executable scripts (Shell, Perl, PHP, etc.).
Output must be in metric status format. The allowed metric status is-
- 0 (OK)
- 1 (WARNING)
- 2 (CRITICAL)
- 3 (UNKNOWN)
Warning and critical are parameters, set by the user, passed as arguments to the plugin.
The plugin can be run:
- Locally on the Nagios server
- Remotely through a remote Nagios server, with SSH, SMTP, NRPE (Nagios Remote Plugin Executor), and NSCA (Nagios Service Check Acceptor).
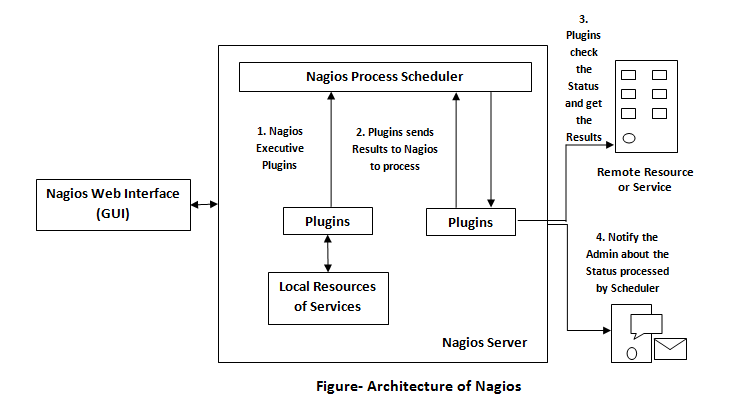
Architecture of Nagios
It is built on server architecture. Nagios server is running on a host. It interacts with local and all the remote hosts that need to be monitored. Plugins will send information to the server, which displays them in a GUI.
Nagios is composed of three parts are as follows-
- A scheduler- This is the server part of the Nagios. At a stipulated time, the scheduler checks the plugins, and according to their results.
- A GUI- The interface of Nagios (with the configuration alerts). It is generated in web pages generated by CGI.
- The plugins- Plugin configurable by the user. They monitor the service and return a result to the Nagios.
An alert emerges when a plugin returns a warning or an error. Then on the GUI, the green button becomes red.
When alert rose many times, the Nagios server sends the notification: SMS or e-mail, etc.
Configuration Files
1. nagios.cfg
- Main configuration file
- Monitored elements configuration
2. resource.cfg
- User-defined elements configuration files
3. cgi.cfg
4. host, host group and hosttextinfo
- Information regarding monitored equipment
5. host and service dependency
- Dependencies between hosts and between services
6. service, servicextinfo
- Information regarding monitored services
- Service growth
7. contact
- It is crucial to be registered in this contact file, to access the Nagios interface.
8. contactgroup
- It contains information related to user groups. Notifications and display privileges are settled in this file.
What is NRPE?
NRPE is the plugin that allows you to execute Nagios plugin on a remote Linux/Unix machine. The main motive for doing this is to allow Nagios to monitor
“local resources” usage on remote machines. For security reasons, public resources are not usually exposed to external machines. Hence, NRPE must be installed on the remote machines. Nagios server monitor with NRPE on port
5666.
It is possible to execute Nagios plugin on remote Linux/ Unix machines through SSH. check_by_ssh plugin allows you to do this. SSH is more secure than NRPE. NRPE has two parts:
- The check_nrpe plugin, which resides on local monitoring machine.
- The NRPE daemon, which runs on the remote machine.
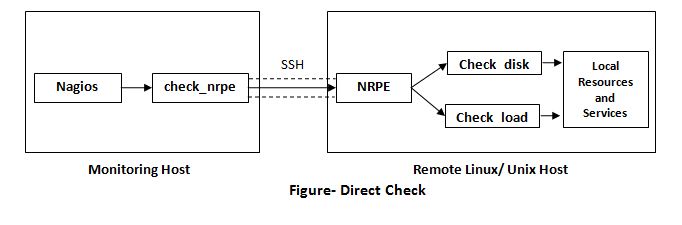
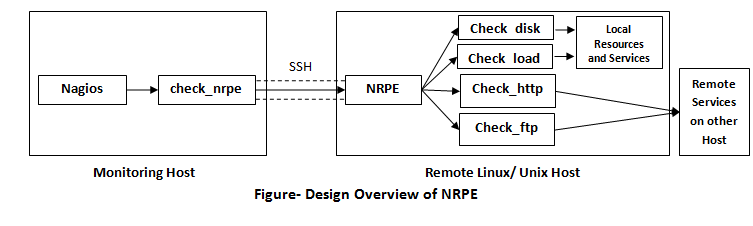 Example Uses
Direct check-
Example Uses
Direct check- It includes things like
CPU load, memory usage, swap usage, disk usage, current user and process states, etc.
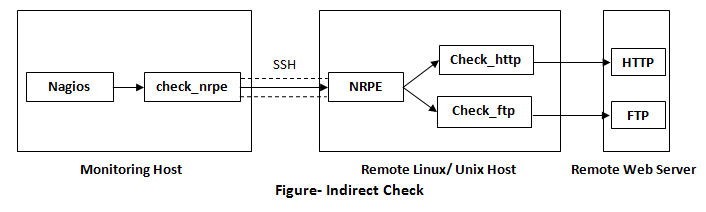
 Indirect check-
 NRPE is also able to do indirect check
“public” services and resources of remote servers that might not be reachable directly from the monitoring host. NRPE daemon is essentially acting as a proxy in this case.
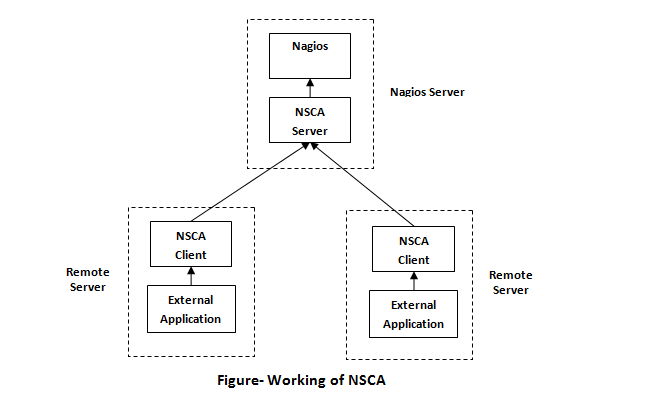
What is NSCA?
NSCA stands for
Nagios Service Check Acceptor. It is a protocol that is used in reverse of the other common Nagios protocol NRPE. You can submit passive (means Nagios is not the inventor of the actual check commands) check results to a Nagios server instead of having the Nagios actively polling. It gives privileges to remote Nagios servers and applications to send passive host and service check results to a Nagios server for processing. The NSCA plugin consists of
two parts:
- The server application- It runs on your Nagios server and listens for client data transfers.
- The client application- It runs on remote systems and is used by external applications to send data to the Nagios server.
Exchange of data between clients and the server can be encrypted to make sure secure data transfer.
 Example of Nagios
Two major problems solve by Nagios are:
alerting and
trending. Alerting is to notify the user in charge of a major event like service falling to work. Trending is to inform the change of something over time disk or memory usage, replication lag, etc.
For proper monitoring, Nagios checks must be carefully chosen and tuned means alert only for important things.
How do you know which one is important? Nagios provides some services. If some event makes it impossible to provide the service at a pre-defined SLA, then the event is important:
- The host is not responding
- Service does not work
- SLA is broken
- One is running out of critical resources: memory, disk space
It does not alert about minor problems like some threshold is exceeded an alert tells us: if you don’t take action, your application failed to provide the service or the SLA will be broken. High load average is the best example of a bad alert. If the load average is high, but SLA is not broken than SLA cares about load average.
Here we use a dedicated server that does nothing but the monitor. To run checks on remote servers, we will use NRPE because it needs fewer resources than SSH. Let us see how and what services are monitored on each server.
Storage server
IP availability
define service
{
use                       generic-service
host_name                 storage-01
service_description       PING
check _command            check_ping!100.0,1%!500.0,1%
}
IP availability check for the network is available or not.
SSH admin access
define service
{
use                       generic-service
host_name                 storage-01
service_description       SSH
check _command            check_SSH
}
Here, non-zero packet loss indicates a problem in the network. SSH admin access checks for an admin login to the server at any time.
MySQL check
define service
{
use                       generic-service
host_name                 app-01
service_description       mysql-deleted-files
check _command            check_nrpe!pmp-check-mysql-deleted-files
}
In this case,
MySQL checks if some important MySQL files are deleted. In the same way, we can check for privileges also.