Node.js Core Debugger
Node.js – Core Debugger: It’s always a challenge when it comes to debug an application. The Asynchronous workflows of Node.js include an additional layer of intricacy to this difficult process. Even though some updates have been made to the JavaScript V8 engine to create access to asynchronous stack traces a bit easier.
Usually, we get errors on the main thread of the applications, making the debugging process a little bit harder. Whenever there is a crash in our Node.js applications, we normally rely on some types of complicated CLI tooling for the analysis of the core dumps.
There are several tools available to debug Node.js applications, which include the following:
- Core Node.js Debugger
- Node Inspector
- IDEs Built-in Debugger
Let’s discuss these tools in brief.
Core Node.js Debugger
Node.js provides a non-graphic built-in debugging utility. It can be used on multiple platforms and provides several commands necessary to debug a Node.js application.
Let’s see a simple Node.js application as follows:
File: mydebug.js
var fs = require('fs');
fs.readFile('newfile.txt', 'utf8', function (err, data) {
    debugger;
    if (err) throw err;
    console.log(data);
});
Inserting debugger in the JavaScript code would let the user to stop the debugger. For example, in the above snippet of code, we have to write a debugger inside the callback function to check the "data" parameter.
Now, to initialize the core debugger of Node.js, start Node.js command-line and type the following command:
$ node <space> inspect <space> script_file.js
In the above command, typing the inspect argument followed by the script's path would let the user to debug the addressed script file. In addition to that, a prompt will be appeared, representing a successful initiative of the debugger.
Here’s an illustration of what we have discussed so far.
$ node inspect mydebug.js
< Debugger listening on ws://12
< 7.0.0.1:9229/7be1f7d9-62aa-4dd3-bee1-ca71011cac4a
< For help, see: https://nodejs.org/en/docs/inspector
< Debugger attached.
Break on start in mydebug.js:1
> 1 var fs = require('fs');
  2
  3 fs.readFile('newfile.txt', 'utf8', function (err, data) {
debug>
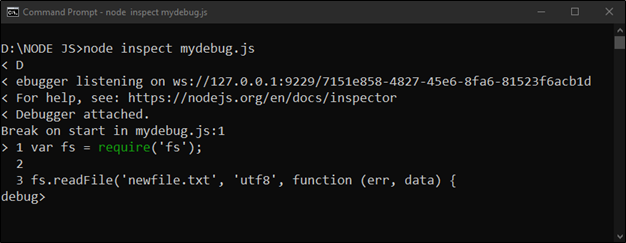
In the above output, the > symbol indicates the current debugging statement. To continue debugging and move to the next statement, use next.
debug> next
break in mydebug.js:3
  1 var fs = require('fs');
  2
> 3 fs.readFile('newfile.txt', 'utf8', function (err, data) {
  4
  5     debugger;
debug>
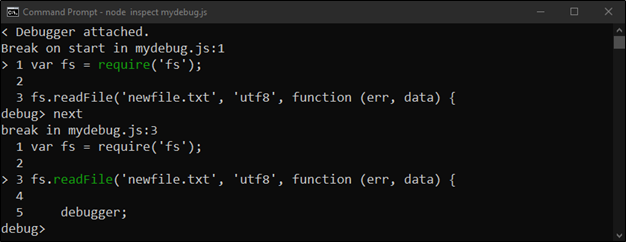
Now, the breakpoint of the debugger is in line: 3. To directly stop the execution to “debugger”, if any, use the cont command.
debug> cont
break in mydebug.js:5
  3 fs.readFile('newfile.txt', 'utf8', function (err, data) {
  4
> 5     debugger;
  6
  7     if (err) throw err;
debug>
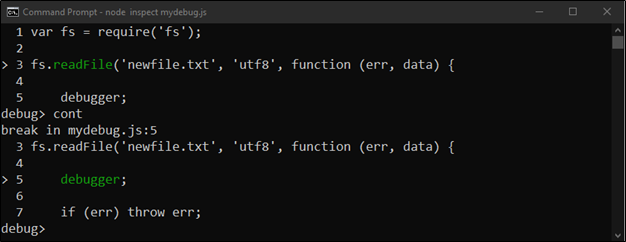
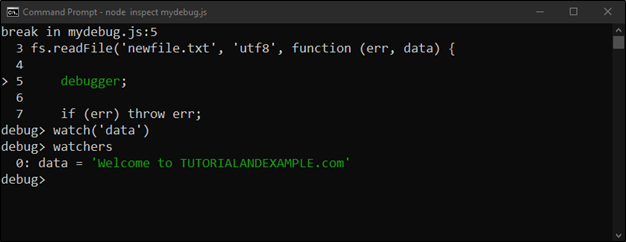
As we can see, our script file has a “debugger” on the fifth line of code; the cont command breaks the debugging at line: 5. Moreover, it is feasible to watch the variable values or expressions while debugging using the watch(‘my_expression’) command. To print the active watcher, type watchers. We can also remove a watcher using unwatch(‘my_expression’). Here’s an output for the same.
debug> watch('data')
debug> watchers
  0: data = 'Welcome to TUTORIALANDEXAMPLE.com'
Just like the above, there are various important commands available in the core debugger of Node.js. Some of them are listed below with their descriptions:
| Command | Description |
| next | The next command allows the user to step on the next line for debugging |
| cont | The cont command allows the user to continue the code's execution until the next debugger present in the code. |
| watch() | The watch() command starts to watch an expression or variable values. |
| watchers | The 'watchers' command prints the active watcher. |
| step | The step command allows the user to step into the function. |
| out | The out command allows the user to step out of the function. |
| pause | The pause command allows the user to pause the debugging process. |