Data Visualization Using Tableau
In this chapter, we will learn about visualization.
We will come across and click the ‘
Sheet’ which is where you start to build our visualization.
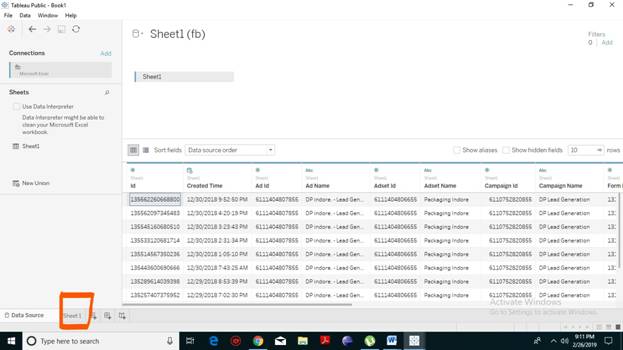
Let’s take a look at all the different pieces of this before we go any further.
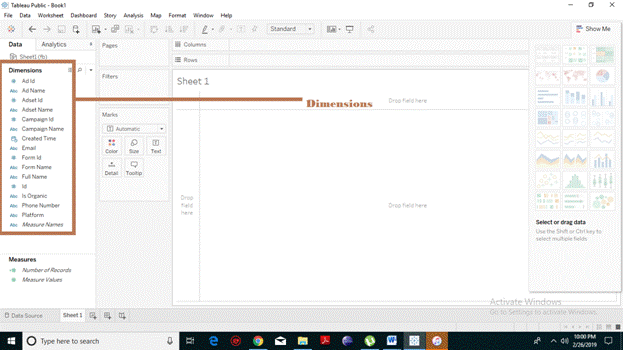
- We have the data that we’re connected to up here it’s our orders sheet from the sample superstore excel sheet. We have Dimensions on top and Measures on the bottom. These are where we are going to get the fields to drag and drop. Dimensions contain descriptive values such as names, dates and geographical data. One can use the dimensions to reveal details in your information that is qualitative details.
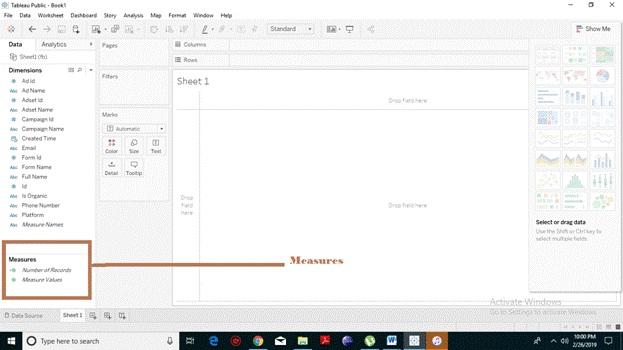
- Measures contain numeric, quantitative values that you can measure. Measures can be aggregated and when you drag a measure on to the view, tableau will automatically apply an aggregation to that measure and will find the sum by default.
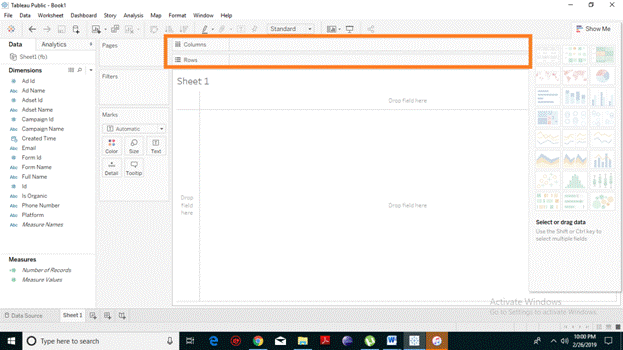
- On the top of the page, we have two shelves, the column shelf, and the row shelf, where you can drag things to make changes happen in the visualization center.
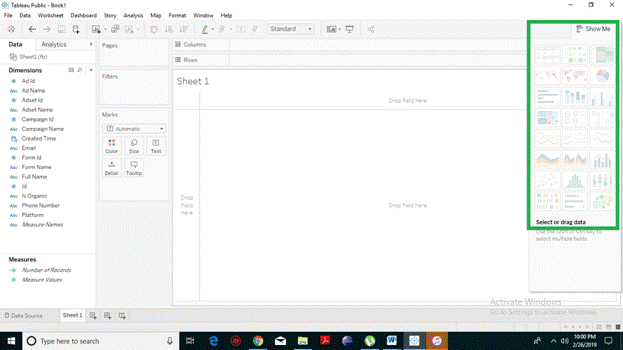
- There is ‘Show Me’ tabs, where you can see all of the different visualizations even you can build here. A good thing about show me tag is that when you hover it’ll tell you what types of fields you need to create it, so for a symbol map you can try one geographical area with 0 or more dimensions or 0 to 2 measures. If you are done with the show me, you can even close it.
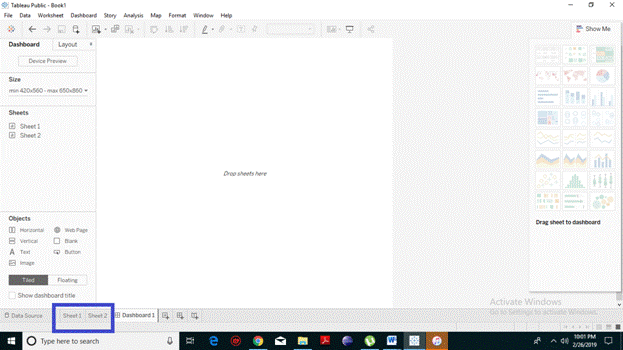
- At the bottom, we have our sheets. In the below-given image we have sheet 1 and sheet 2. A sheet is basically in just one visualization at a time.
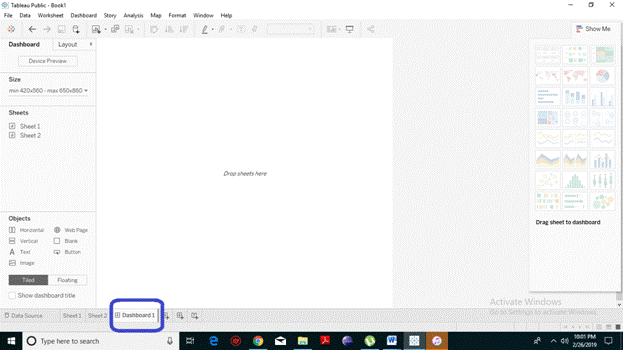
- Next, we have a dashboard which is where you can pull multiple sheets on to show various visualizations at one time.
- Up next we have Marks which is used for formatting the shape and size of the text or adding color to it. So that, visually you can make it more attractive.
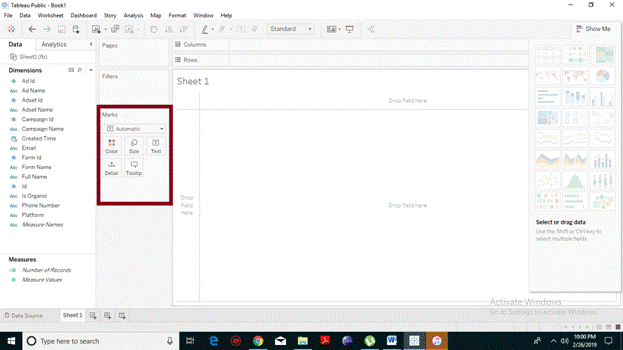
While operating the Tableau desktop, you get the menu at the top which shows all the commands we can navigate. Let’s go through the various important features under the menu.
Menu Commands
On closing the window, you will get the primary interface with all the available Menu commands. It represents the entire set of features available in Tableau. Various details of the menu are explained in the following.
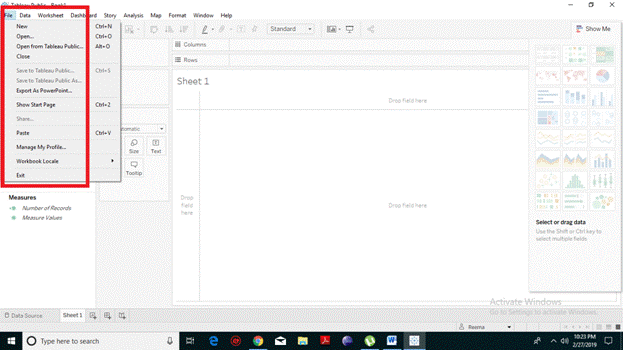
File Menu
The file menu is used to create a new Tableau workbook. It opens the existing workbooks from both the local system and Tableau server.
The crucial features of File Menu are:
- It is used to set the language to be used in the report.
- It is used to paste a sheet into the current workbook.
- File Menu is used to create a packaged book, which can further be shared with other users.
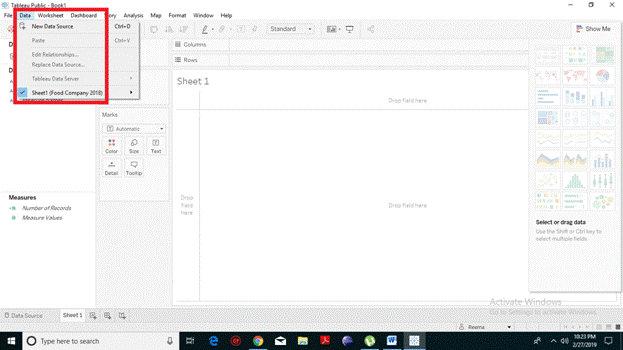
Data Menu
Data Menu allows the users to create a new data source. This option fetches the input for visualization and analysis. It also enables users to upgrade or replace the existing data source.
The crucial features of the Data Menu are as follows:
- Data Menu allows the users to view and choose from all the types of connections available.
- This option refreshes the data from the source.
- This option defines the fields in more than one data source which can be further used for linking.
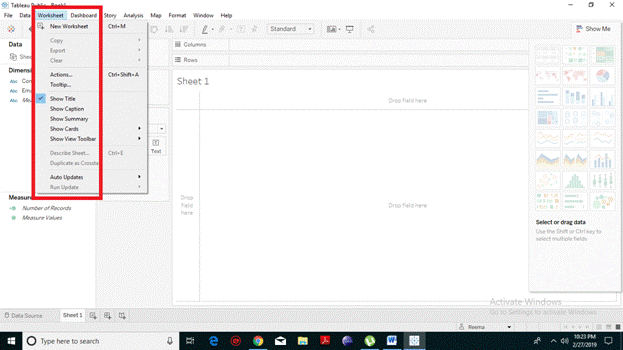
Worksheet Menu
Worksheet menu enables the users to create a new worksheet along with numerous display features such as presenting the captions and title, etc.
The crucial features of the Worksheet Menu are as follows:
- This option permits you to view the summary of the data which is used in the worksheet such as, total, expenditure, etc.
- Another great feature of this option is that it shows the tooltip when you hover above various data fields.
- It updates the used worksheet data or filters.
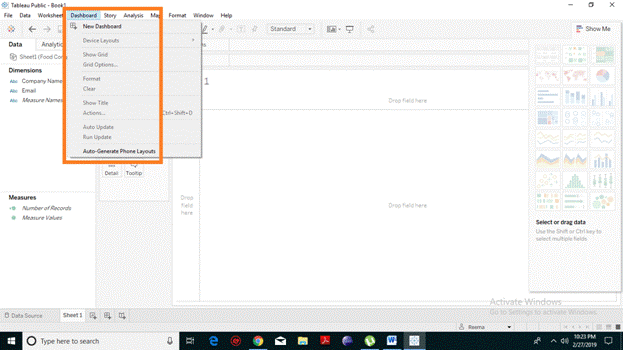
Dashboard Menu
Dashboard menu is used to generate a new dashboard along with various display features, unlike exporting the image and showing the title, etc.
The crucial features of the Dashboard Menu are as follows:
- This option is used to format sets the layout in terms of colors and sections of the dashboard.
- It has pre-defined actions that link the dashboard sheets to other sheets or external URLs.
- It provides an Export Image option that is used to export an image to the Dashboard.
- This option also provides some auto-generate layouts.
Story Menu
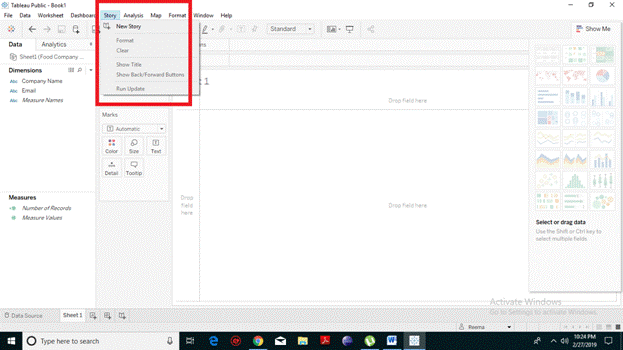
Story menu allows you to show a sequence of visualizations so that you can create a new story which has many dashboards or sheets with related information.
The crucial features of the Story Menu are as follows:
- This option sets the layout’s colors and sections of the story to enhance the visualization.
- It enables the updates of the story with the latest data fetched from the source.
- It is used to update or export an image of the story.
Analysis Menu
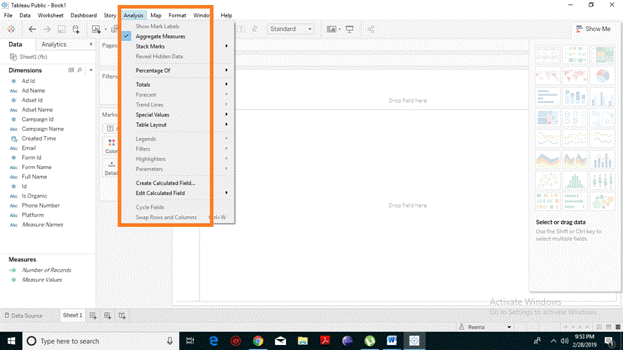
Analysis menu is used for analyzing the data present in the sheet. Tableau provides many out-of-the-box features, such as calculating the percentage and performing a forecast, etc.
The crucial features of the Analysis Menu are as follows:
- This option shows a forecast based on available information.
- It shows the trend line for a series of data.
- Analysis menu is used to create a calculated Field option which further creates additional fields based on the accurate calculation on the existing grounds.
Map Menu
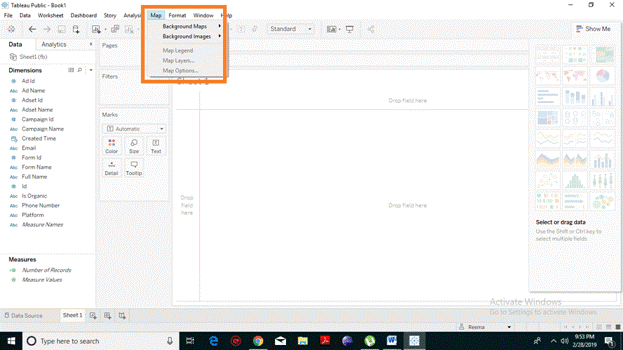
Map menu is used for building map illustration in Tableau. You can assign substantial roles to fields in your data.
The crucial features of the Map Menu are as follows:
- This option reflects the maps Layers, such as street names, state type, country borders, and also adds various data layers.
- It is used to create new geographic roles and assigns the fields in your data.
- Map Menu also gives freedom to the users for background images.
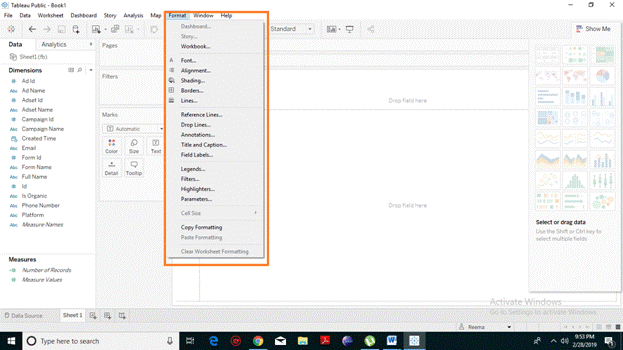
Format Menu
As the name suggests, this menu is used for applying the numerous formatting options to boost the look and feel of the dashboards creative. It provides features such as attractive borders, colors, alignment of text, etc.
The crucial features of the Format Menu are as follows:
- This option applies various style borders to the fields displayed in the report.
- It assigns a title and caption to the reports.
- It customizes the size of the cells presenting the data.
- This option applies a theme to the entire workbook.
- Format Menu consists of various filters to enhance the look.
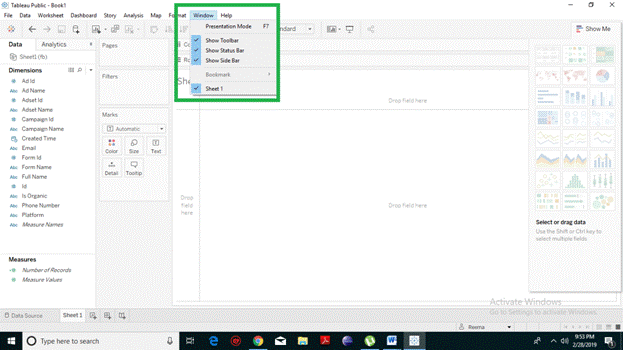
Window Menu
Window Menu analysis the presentation your page. It is used to show the details of the window or also helps in bookmarking the page. It opens many possibilities and improves the user to manage its toolbars, status bar, etc.
The crucial features of the Window Menu are as follows:
- This option enables the user to choose whether he wants the various toolbars on page or not.