×

Tableau Data Blending

Introduction to Tableau Data Blending

Data Blending is a very advantageous feature in Tableau. Data blending is referred to as a technique where on a single worksheet, the data is blended from multiple data source. It is used when there is correlated data in different data sources, and you want to evaluate both data sources in a single view. The two sources are stated as primary and secondary data sources. The key points of data blending are mention below:
  • The data is attached to standard dimensions.
  • Data blending does not create row level joins. This technique does not add new dimensions or rows to your data. Instead of joining the data at the row level like a cross-database join, data blending sends separate queries to the separate data sources and finally aggregates the results to a common level back in Tableau.
  • It should be used when you have correlated data in different data sources that you want to analyze them together in a single view to find the commonalities and compare both the data.
  • To combine your data, you should first add one of the standard measures or dimensions from the primary data source to your view.

Data Blending on a Worksheet

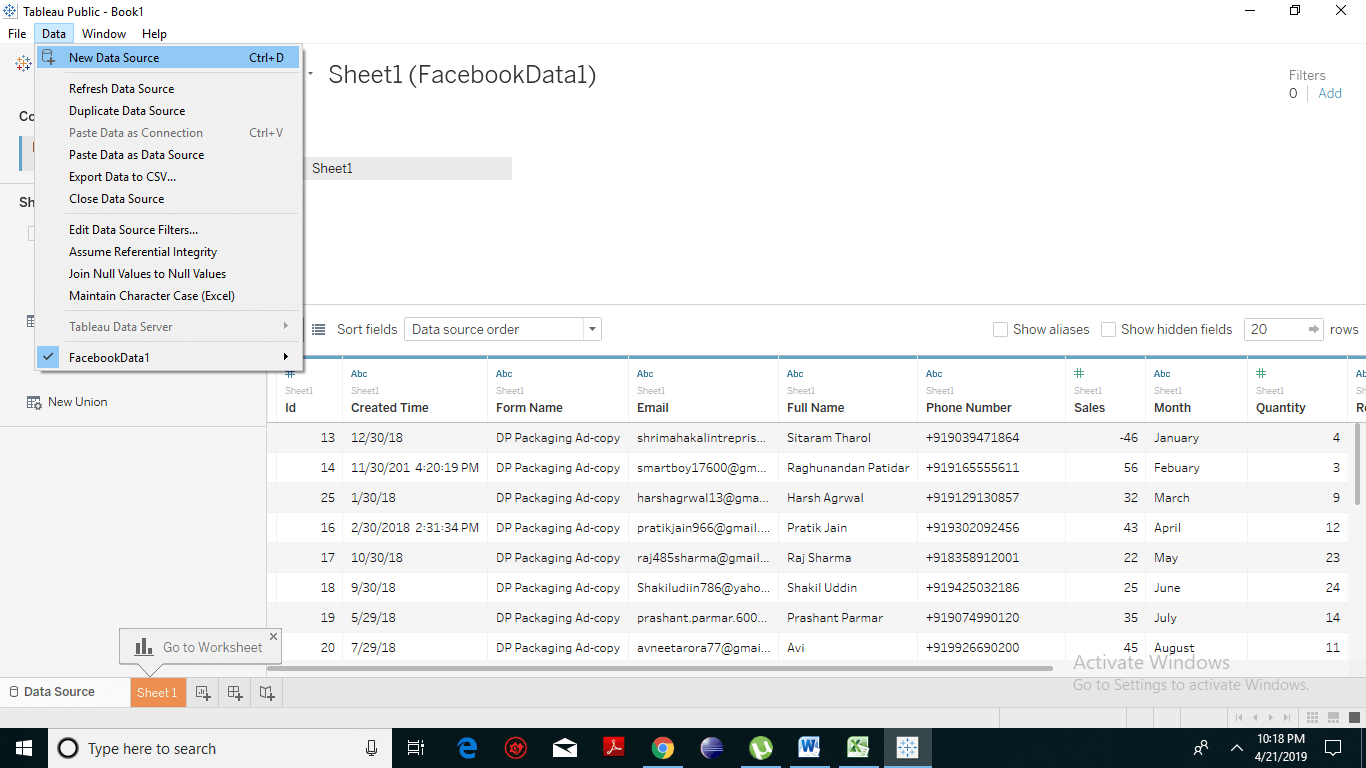
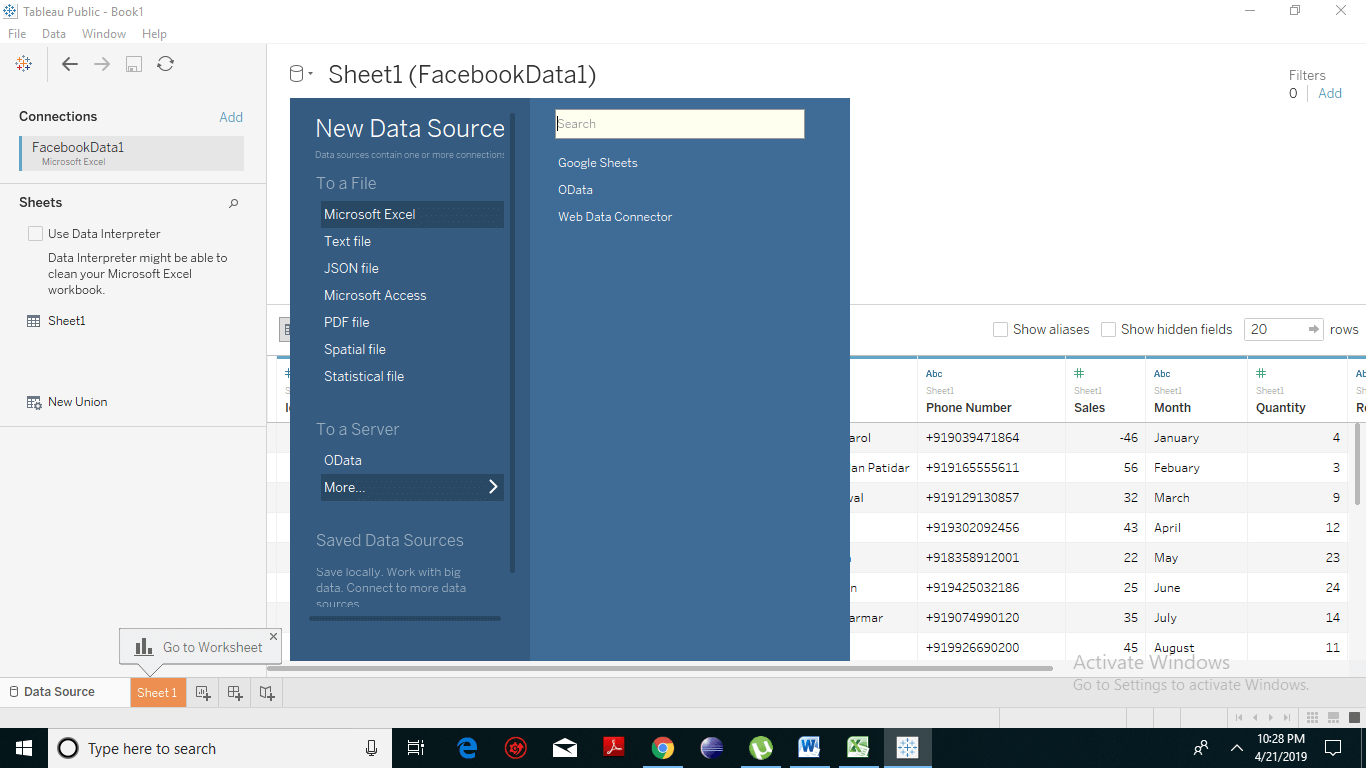
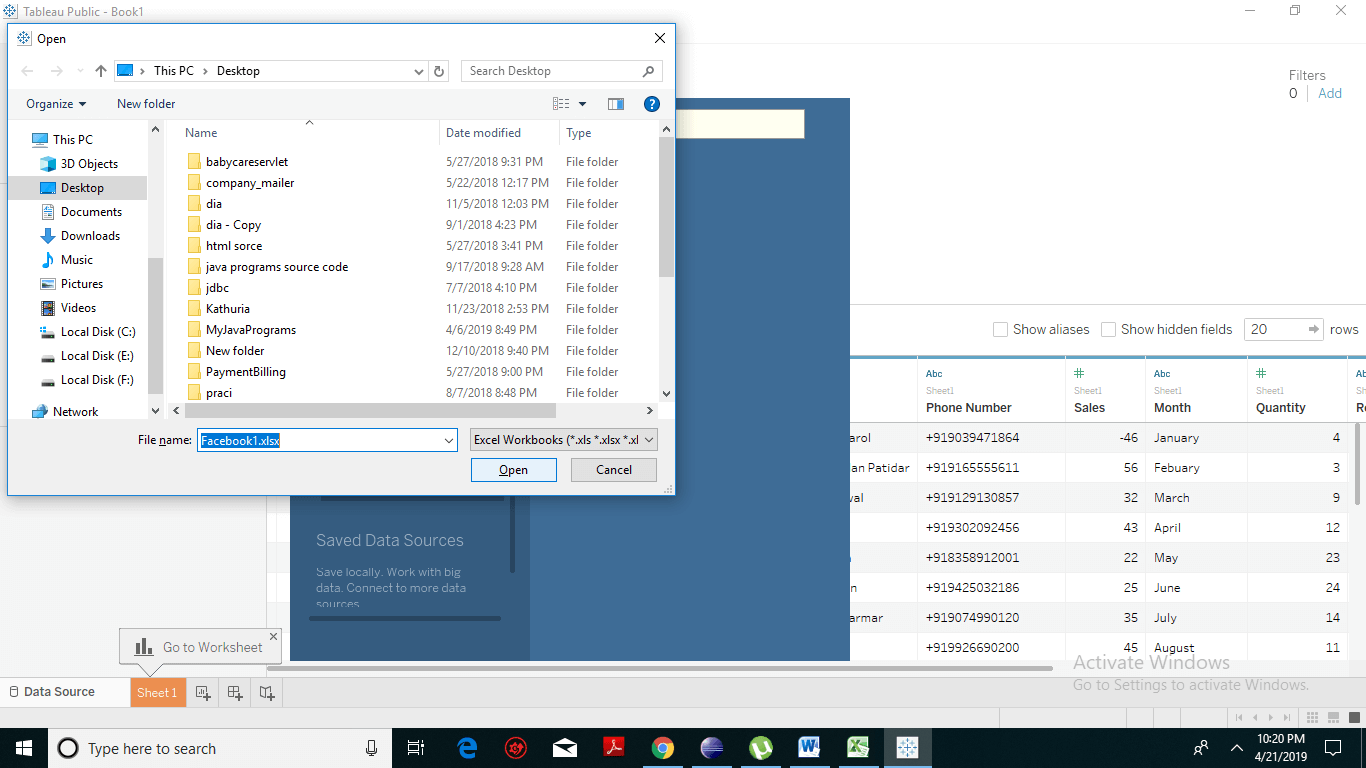
Here, we have two related in excel file format one is facebook data in 2018 and Facebook data in 2019. Through data blending we are going to combine both the data into a single view, to compare actual sales to target sales, you need to blend the data based on standard dimensions to get access to the Sales measure. The following steps indicate the use of data from both data sources on a single worksheet: Step: 1 First load your excel file here we have facebook actual sales data to Tableau. Go to the menu -> Click on Microsoft -> A dialogue box will appear. Browse for the sample Facebook data file, Excel file. This is known as the primary file. Step: 2 The next step is to integrate your secondary data with Tableau. Load your secondary file named with Sample-superstore by again following the steps - Data ? New Data Source and choosing this data source. Tableau Data Blending 1 Step: 3 You will notice that the main menu has appeared on the screen. Click on Microsoft Excel option. A dialogue box will appear. Data Blending on a Worksheet Step: 4 Browse for the data file, i.e., Excel file. Click on the open option. Data Blending on a Worksheet Step: 5 If the field names are different but have common members, we can manually define their relationship. For example, we know that direction in Facebook lead 1 and Facebook 2019 contain the values ‘East,’ ‘West,’ ‘North,’ ‘South,’ as Region. Step: 6
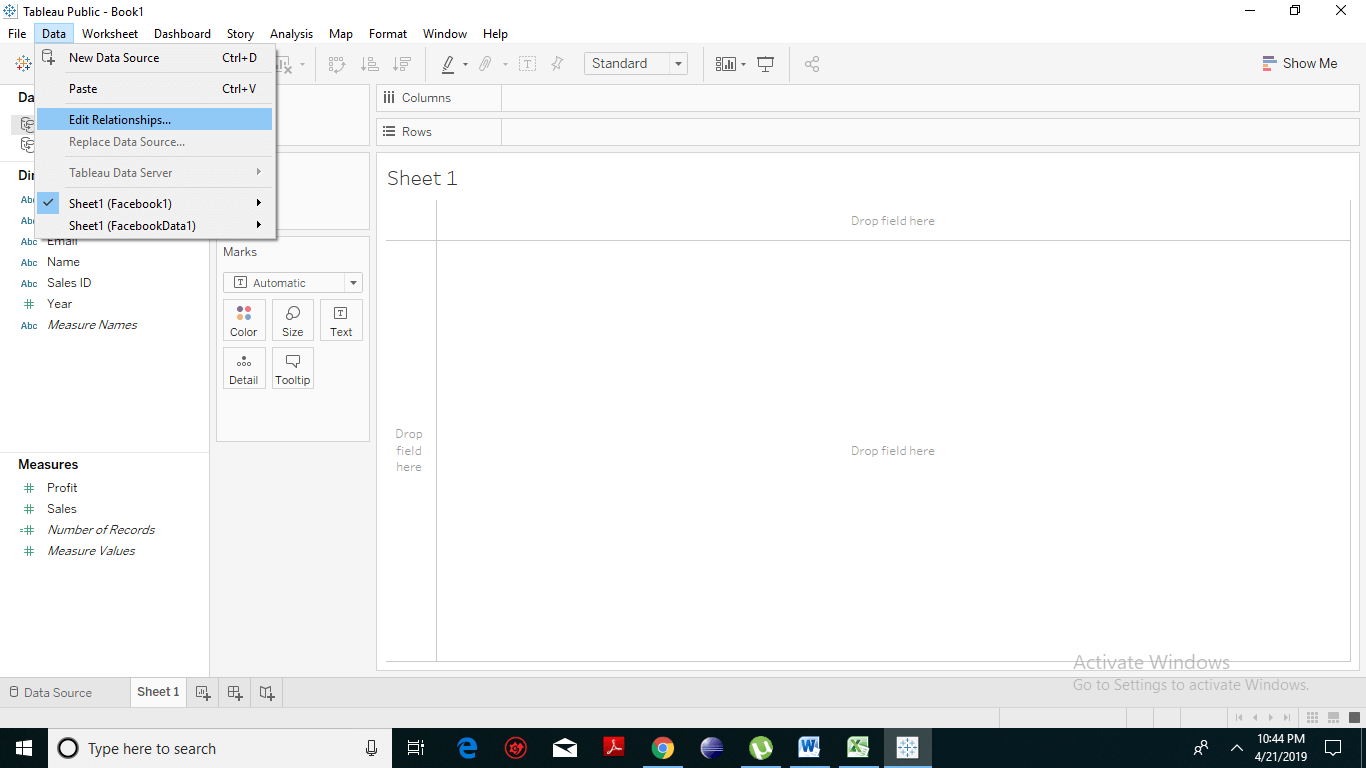
  • We’ll go to the data menu -> select edit Relationships.
Data Blending on a Worksheet
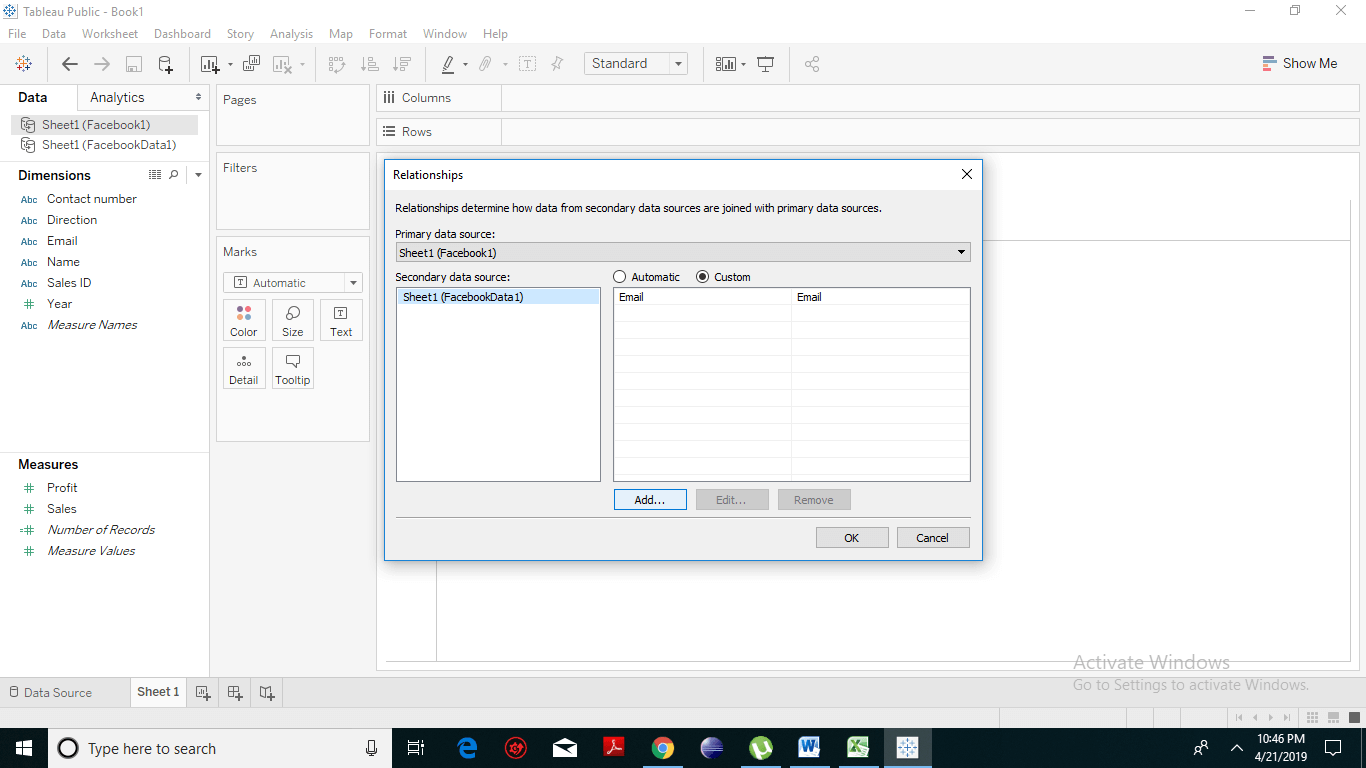
  • You will notice that a dialogue box has appeared. Select custom and then -> click on add relationship.
Data Blending on a Worksheet
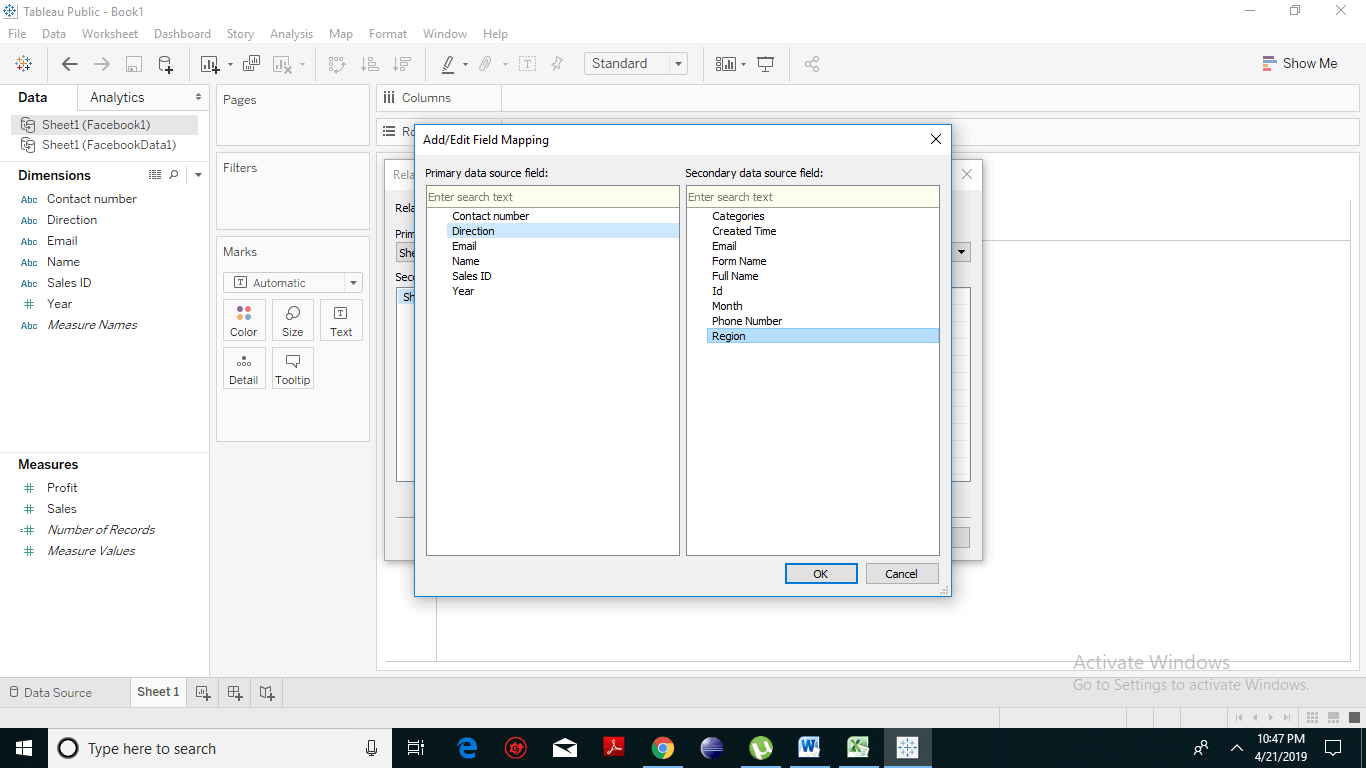
  • We’ll choose the direction and region. Click on ok. You will notice that the tableau has established a relationship between the two fields and also lists the automatic relationship.
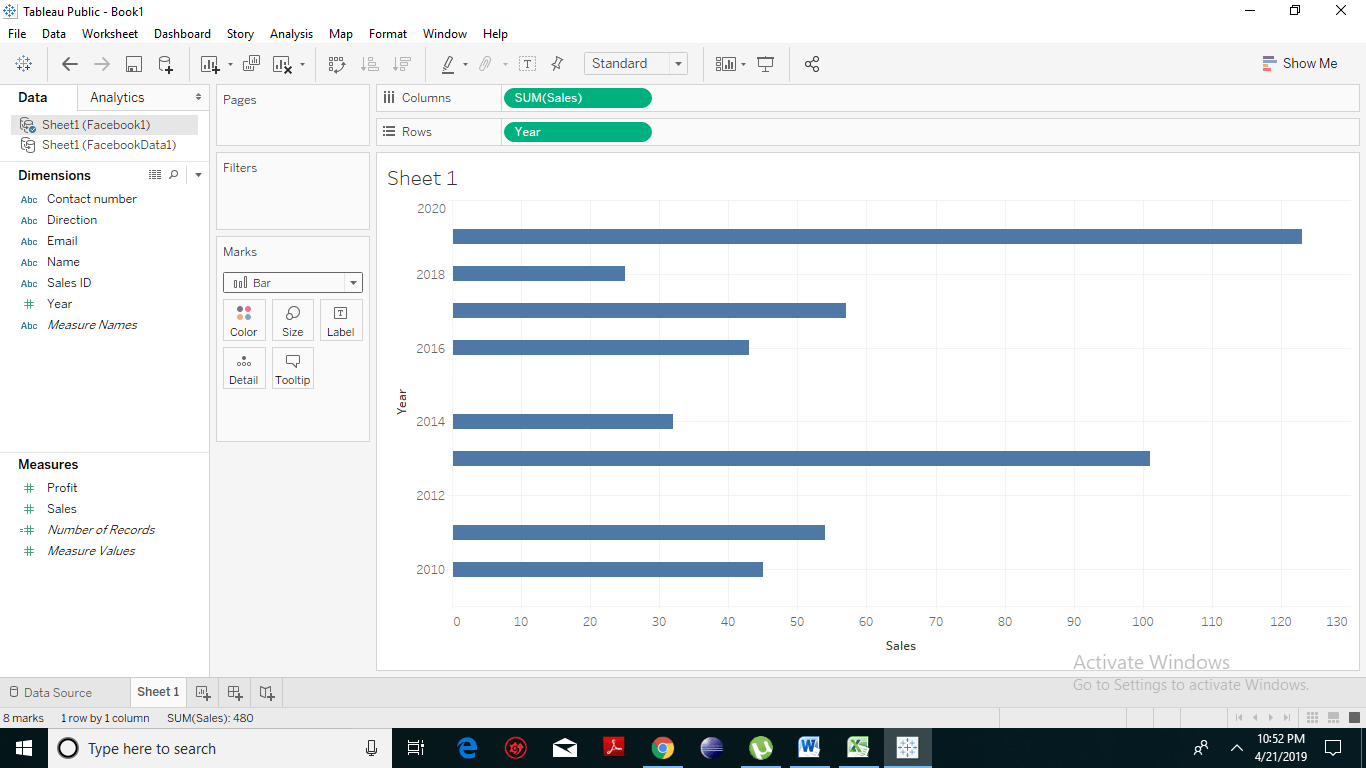
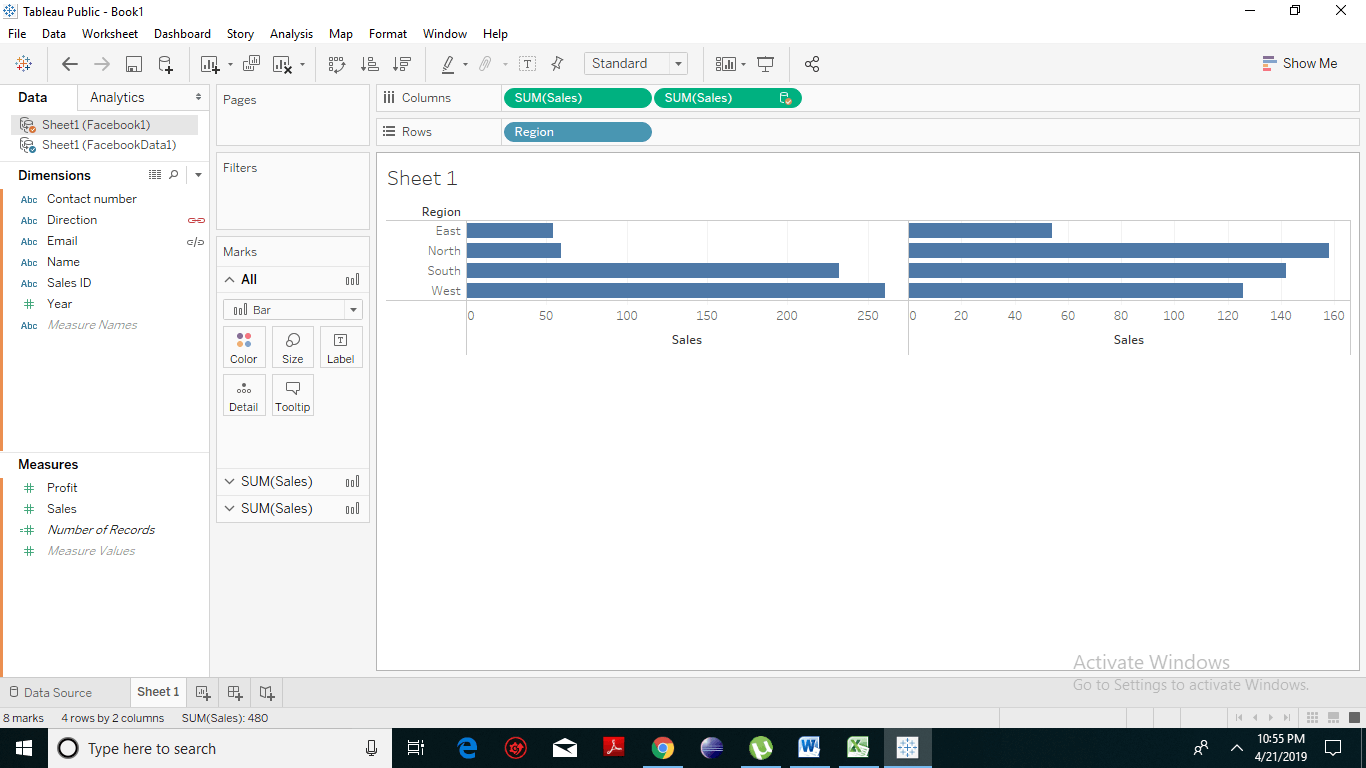
Data Blending on a Worksheet Step: 7 We’ll drag Facebook 2019 Sales to the columns shelf and we’ll bring year to the Rows shelf. You will note that there is now a blue check mark next to Office City in the data pane. Data Blending on a Worksheet Step: 8 Whenever connected to multiple data sources, the first data source which we bring to the view becomes the primary, denoted by this blue check mark. You can see the orange linking icon next to State when you switch to the second data source. Step: 9 At last, you can integrate the data from both the above sources based on the similar dimension or measure. Let’s complete our data blend by dragging Facebook 2 Sales to the column shelf, and you will notice the following chart comparing the Sales of two files: Data Blending on a Worksheet
Related Topics

Tableau Motion Chart

Motion charts are a type of chart that allows you to visualize in action displaying the changes of your data over time by indicating the movement of data points within...

2 minutes read.

Tableau Bump Chart Tutorial

How to Create Tableau Bump Chart? A Bump Chart shows a comparison between two dimensions using a measure of your choice. It is a line chart which is used when we...

2 minutes read.

Tableau Histogram Chart

Histogram chart in Tableau A histogram is a chart that represents the accurate distribution of numerical data. A histogram represents the actual frequencies of values of a variable bucketed into ranges....

2 minutes read.

Tableau Connectivity with Excel

Connect Excel to Tableau server Step by Step Let’s get started by connecting tableau to a data source:   Step: 1 Click on Microsoft Excel   Step: 2 Choose your excel file and open it...

1 minute read.

Introduction to Tableau

 What is Business Intelligence? Companies use business intelligence technologies to collect, analyze and present data to create actionable information. Today’s businesses are always seeking insights about their customers, products, and services. So...

3 minutes read.

Tableau Scatter Plot

Tableau Scatter plot with Dimensions The scatter plot represents the data in which many points are scattered in the Cartesian plane according to the given figures. It is generated by plotting...

2 minutes read.

Tableau Data Types

Data Types in Tableau Tableau is a fastest growing and powerful data visualization tool which is primarily used in the Business Intelligence. Since every tool stores its data into some memory...

2 minutes read.

Difference between Tableau and Excel

Why is Tableau used instead of Excel? Tableau is a fastest growing and powerful data visualization tool which is primarily used in the Business Intelligence Industry whereas Microsoft Excel is a...

2 minutes read.

Tableau Server Architecture Components

Tableau Architecture Explanation Tableau provides a scalable solution for the delivery and creation of web, mobile and desktop analytics. Tableau Server is an analytics platform that is used to level up thousands...

2 minutes read.

Tableau Gantt Chart

How to create a Gantt Chart in Tableau A Gantt chart is a type of chart that shows the development and duration of the event or resource over a period of...

2 minutes read.

Tableau file Extensions

Tableau data file Extensions The output of Tableau’s data analysis can be saved in different formats, which further can be distributed on different platforms. The various forms are reflected as different...

2 minutes read.

Tableau Numeric Calculations

Introduction to Tableau Numeric Calculations In Tableau, the Numeric calculations are done by using an extensive range of inbuilt functions available in the formula editor. Numeric calculations allow you to perform...

2 minutes read.

Application of Tableau

Tableau is a powerful data visualization tool used in the Business Intelligence Industry. It is used for many online training modules and data sets relevant to business or marketing. Tableau...

2 minutes read.

Tableau Date Functions

Tableau Date Functions with Examples Dates are crucial fields which are widely used in data analysis. Hence, Tableau provides a large number of inbuilt date functions that allows you to manipulate...

2 minutes read.

Tableau String Functions

Tableau Calculation string functions with Examples Tableau has many inbuilt string functions, which allow you to manipulate string data. They are used to for comparing, concatenating and for replacing few characters...

2 minutes read.

Tableau Tutorial

Introduction to Tableau: Intellectual, strategic, smart and real-time decision making is a must for the development of any organization. Previous years, all those decisions made by revising, analyzing documented reports...

9 minutes read.

Tableau Visualization

Data Visualization Using Tableau In this chapter, we will learn about visualization. We will come across and click the ‘Sheet’ which is where you start to build our visualization. Let’s take a look...

5 minutes read.

Tableau Operator

Operator in Tableau An operator is referred to as a symbol that often tells the compiler to execute certain mathematical or logical operations. Tableau accepts the same operators which are used...

4 minutes read.

Components of Tableau Server

Core Components of Tableau Server Tableau Server's work is directed primarily with the following four server processes: Application Server VizOL Server Data Server Gateway Application Server: It controls hold browsing and various...

2 minutes read.

Tableau LOD Expressions

LOD Expressions LOD or Level of Detail expressions computes values at the data source and the visualization level instead of bringing all the data to the Tableau interface. However, LOD expressions...

3 minutes read.
