Best Python Libraries for Machine Learning
Machine Learning is an important technology in modern days. It helps us to do the things which were not possible in previous days. If you have interest in Machine Learning then you must know that we have to use different algorithms for this purpose. But it is very time taking process. Just think about an algorithm which has to be manually implemented. So, you have to write all the codes manually. It is very time consuming and boring. To get rid of this, we can use libraries, modules. You must know that Python is a very powerful language for machine learning. It has many libraries to implement Machine Learning algorithms. For this reason, it has become one of the strongest languages for implementing Machine Learning algorithms. In this article, we will discuss about Machine Learning algorithms in details. This article will be helpful for all people who have interest in machine learning. If you are a beginner in Machine Learning then it will be most useful for you.
Let’s see the different Python libraries for implementation of Machine Learning algorithms.
Different Python Libraries
- Keras
- Matplotlib
- Numpy
- Pandas
- PyTorch
- Scikit-learn
- Scipy
- TensorFlow
- Theano
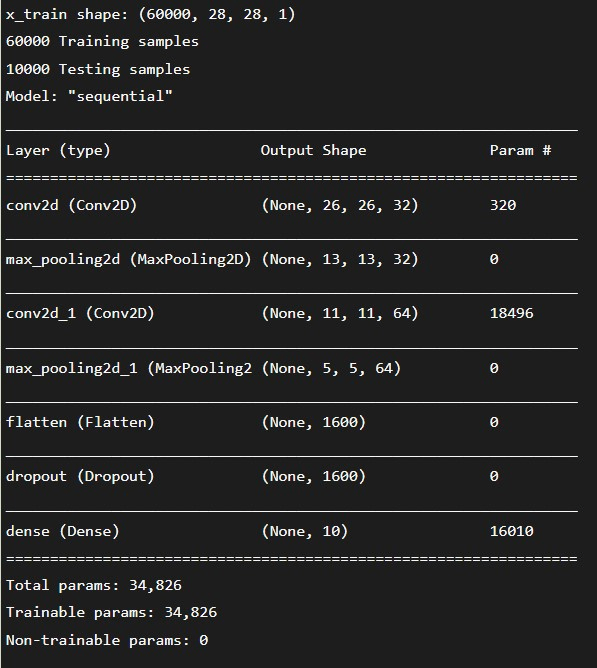
1. Keras
It is one of the most famous and popular libraries of Python. It helps Machine Learning beginners a lot. It smoothly runs on both CPU and GPU. It is considered as high level neural network API. It can run on top of TensorFlow, CNTK, or Theano. One of the main advantage of keras is it can be used for fast and simple prototyping.
Example:
import numpy as nup
from tensorflow import keras as ks
from tensorflow.keras import layers as ls
number_classes = 10
input_shapes = (28, 28, 1)
 (x_1_train, y_1_train), (x_2_test, y_2_test) = ks.datasets.mnist.load_data()

x_1_train = x_1_train.astype("float32") / 255
x_2_test = x_2_test.astype("float32") / 255
x_1_train = nup.expand_dims(x_1_train, -1)
x_2_test = nup.expand_dims(x_2_test, -1)
print ("x_train shape:", x_1_train.shape)
print (x_1_train.shape[0], "Training samples")
print (x_2_test.shape[0], "Testing samples")
y_1_train = ks.utils.to_categorical(y_1_train, number_classes)
y_2_test = ks.utils.to_categorical(y_2_test, number_classes)
model_1 = ks.Sequential(
    [
        ks.Input(shape = input_shapes),
        ls.Conv2D(32, kernel_size = (3, 3), activation = "relu"),
        ls.MaxPooling2D(pool_size = (2, 2)),
        ls.Conv2D(64, kernel_size = (3, 3), activation = "relu"),
        ls.MaxPooling2D(pool_size = (2, 2)),
        ls.Flatten(),
        ls.Dropout(0.5),
        ls.Dense(number_classes, activation = "softmax"),
    ]
)
model_1.summary()
Output:
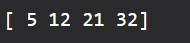
2. Matplotlib
This library mainly used for visualization of data. Data scientists use this to check the pattern of data. It mainly shows 2D graphs and charts. There is a module named Pyplot by which we can control different properties of graph or chart like axes, colour and other things. It is not directly related to Machine Learning but it helps developers to visualize the pattern of the data. It is very famous for data visualizing. It can be used to make interactive figures. We can zoom, pan or update these figures. By using this we can customize visual style and layout. We can export several file formats.
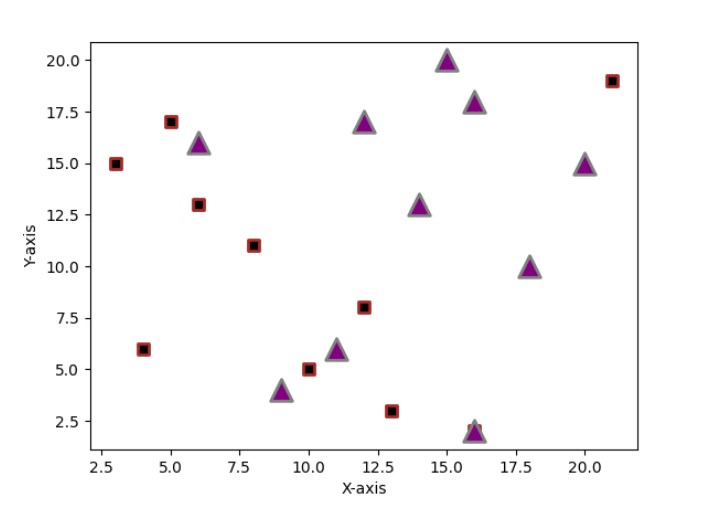
Example 1:
import matplotlib.pyplot as plot
K_1 = [8, 4, 6, 3, 5, 10,
      13, 16, 12, 21]
R_1 = [11, 6, 13, 15, 17, 5,
      3, 2, 8, 19]

K_2 = [6, 9, 18, 14, 16, 15,
      11, 16, 12, 20]
R_2 = [16, 4, 10, 13, 18,
      20, 6, 2, 17, 15]
plot.scatter(K_1, R_1, c = "Black",
            linewidths = 2,
            marker = "s",
            edgecolor = "Brown",
            s = 50)
plot.scatter(K_2, R_2, c = "Purple",
            linewidths = 2,
            marker = "^",
            edgecolor = "Grey",
            s = 200)
plt.xlabel ("X-axis")
plt.ylabel ("Y-axis")
print ("Scatter Plot")
plt.show()
Output:
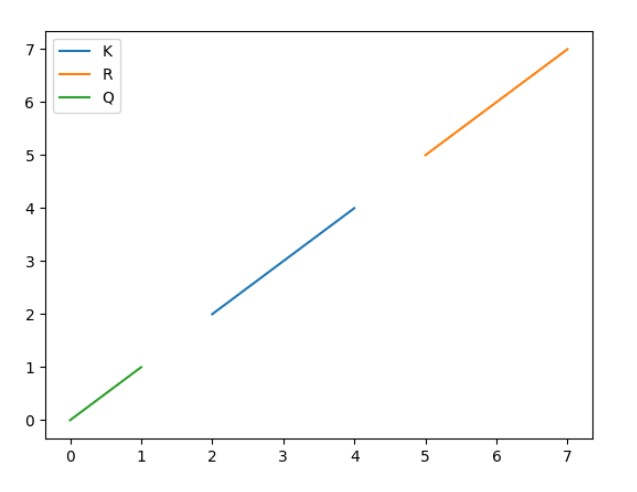
Example2:
import matplotlib.pyplot as plot
import numpy as nup
K = nup.linspace(2, 4, 8)
R = nup.linspace(5, 7, 9)
Q = nup.linspace(0, 1, 3)
plot.plot(K, K, label = 'K')
plot.plot(R, R, label = 'R')
plot.plot(Q, Q, label = 'Q')
plot.legend()
plot.show()
Ouput:
3. Numpy
It is one of the most famous libraries of Python for Machine Learning development. We can use this library for computations. This library can help us by forming multi-dimensional data from mathematical functions and formulas. This library is used for linear algebra.
Example 1:
import numpy as nup
K = nup.array([[2, 4], [6, 8]])
R = nup.array([[1, 3], [5, 7]])
P = nup.array([10, 12])
S = nup.array([9, 11])
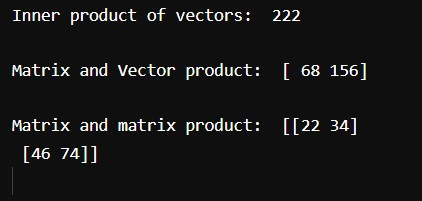
print ("Inner product of vectors: ", nup.dot(P, S), "\n")
print ("Matrix and Vector product: ", nup.dot(K, P), "\n")
print ("Matrix and matrix product: ", nup.dot(K, R)) Output:
Example2:
import numpy as np
x = np.array([[1, 2], [3, 4]])
y = np.array([[5, 6], [7, 8]])
v = np.array([9, 10])
w = np.array([11, 12])
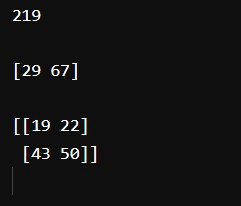
print(np.dot(v, w), "\n")
print(np.dot(x, v), "\n")
print(np.dot(x, y))Output:
4. Pytorch
It is one of the most famous libraries of Python for Machine Learning development. By using this library you can do computational tasks. There are many tools available in this library. It is a open source Python Machine Learning library. It is implemented in C language.
Example1:
import torch as tch
d_type = tch.float
device_1 = tch.device("cpu")
N_1 = 62
D_in_1 = 1000
H_1 = 110
D_out_1 = 11
K = tch.randn(N_1, D_in_1, device = device_1, dtype = d_type)
R = tch.randn(N_1, D_out_1, device = device_1, dtype = d_type)
K_1 = tch.randn(D_in_1, H_1, device = device_1, dtype = d_type)
K_2 = tch.randn(H_1, D_out_1, device = device_1, dtype = d_type)
learning_rate_1 = 1e-6
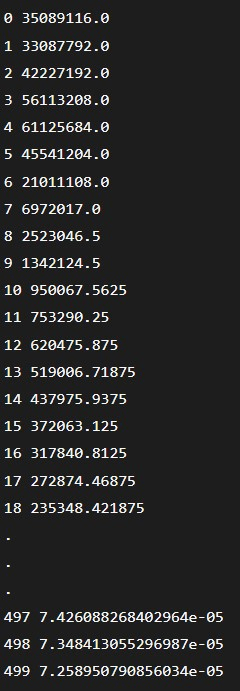
for Q in range(500):
h_1 = K.mm(K_1)
h_relu_1 = h_1.clamp(min = 0)
y_pred_1 = h_relu_1.mm(K_2)
loss = (y_pred_1 - R).pow(2).sum().item()
print (Q, loss)
grad_y_pred = 2.0 * (y_pred_1 - R)
grad_K_2 = h_relu_1.t().mm(grad_y_pred)
grad_h_relu = grad_y_pred.mm(K_2.t())
grad_h = grad_h_relu.clone()
grad_h[h_1 < 0] = 0
grad_K_1 = K.t().mm(grad_h)
K_1 -= learning_rate_1 * grad_K_1
K_2 -= learning_rate_1 * grad_K_2 Output:
Example2:
import torch
import math
dtype = torch.float
device = torch.device("cpu")
x = torch.linspace(-math.pi, math.pi, 2000, device=device, dtype=dtype)
y = torch.sin(x)
a = torch.randn((), device=device, dtype=dtype)
b = torch.randn((), device=device, dtype=dtype)
c = torch.randn((), device=device, dtype=dtype)
d = torch.randn((), device=device, dtype=dtype)
learning_rate = 1e-6
for t in range(2000):
y_pred = a + b * x + c * x ** 2 + d * x ** 3
loss = (y_pred - y).pow(2).sum().item()
if t % 100 == 99:
print(t, loss)
grad_y_pred = 2.0 * (y_pred - y)
grad_a = grad_y_pred.sum()
grad_b = (grad_y_pred * x).sum()
grad_c = (grad_y_pred * x ** 2).sum()
grad_d = (grad_y_pred * x ** 3).sum()
a -= learning_rate * grad_a
b -= learning_rate * grad_b
c -= learning_rate * grad_c
d -= learning_rate * grad_d
print(f'Result: y = {a.item()} + {b.item()} x + {c.item()} x^2 + {d.item()} x^3')
5. Pandas
It is one of the most famous libraries of Python for Machine Learning development. This library is used for data analysis. You can use different tools provided here for analysing your data. It is specifically build for data analysis. So, it can help developers a lot.
Example1:
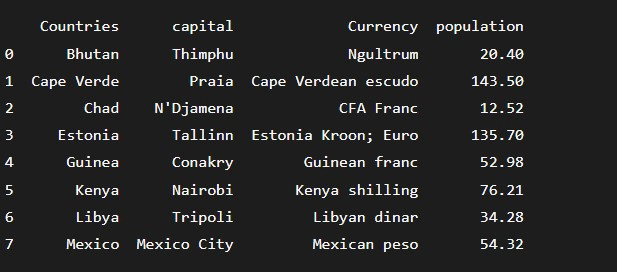
import pandas as pad
   data_2 = { "Countries": ["Bhutan", "Cape Verde", "Chad", "Estonia", "Guinea", "Kenya", "Libya", "Mexico"],
      "capital": ["Thimphu", "Praia", "N'Djamena", "Tallinn", "Conakry", "Nairobi", "Tripoli", "Mexico City"],
       "Currency": ["Ngultrum", "Cape Verdean escudo", "CFA Franc", "Estonia Kroon; Euro", "Guinean franc", "Kenya shilling", "Libyan dinar", "Mexican peso"],
       "population": [20.4, 143.5, 12.52, 135.7, 52.98, 76.21, 34.28, 54.32]
}

data_2_table = pad.DataFrame(data_2)
print(data_2_table)
Output:
Example2:
import pandas as pd
data = {'Name':['Jai', 'Prince', 'Gaura', 'Anu','Ji', 'Prini', 'Gaurav', 'Anuj','Jvi', 'Prici', 'Gauv', 'Aaj'],
 ‘Graduation yr’:[ 2020, 2021, 2017, 2015, 2010, 2018, 2020, 2021, 2017, 2015, 2010, 2018 ],
		'Age':[ 27, 24, 22, 32, 27, 24, 22, 32,27, 24, 22, 32 ],
		'Address':[ “Kanpur”,  'Allahabad', 'Kannauj', 'Delhi',  'Kanpur', 'Allahabad',  'Kannauj', 'Delhi',  'Kanpur',  'Allahabad',  'Kannauj', 'Delhi',  'Kanpur', 'Allahabad',  'Kannauj'],
		'Qualification':['Msc',  'MA',  'MCA' , 'Phd', 'Msc', 'MA', 'MCA', 'Phd','Msc', 'MA', 'MCA', 'Phd']}
dat = pd.DataFrame(data)
print (dat [['Name', 'Qualification']])
6. Scikit-learn
This Python library is very famous among developers. In this library we can implement both supervised and unsupervised algorithms. This library is build from two main libraries of Python which are Numpy and Scipy. This library can help us in data analysis and data mining. We can use this library for implementing Machine Learning algorithms.
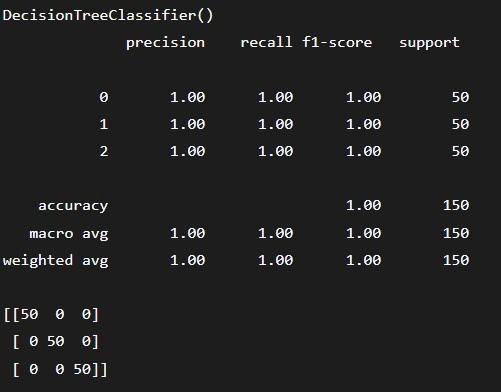
Example1:
from sklearn import datasets as ds
from sklearn import metrics as mt
from sklearn.tree import DecisionTreeClassifier as dtc
dataset_1 = ds.load_iris()

model_1 = dtc()
model_1.fit(dataset_1.data, dataset_1.target)
print(model)

expected_1 = dataset_1.target
predicted_1 = model_1.predict(dataset_1.data)

print (mt.classification_report(expected_1, predicted_1))
print(mt.confusion_matrix(expected_1, predicted_1))
Output:
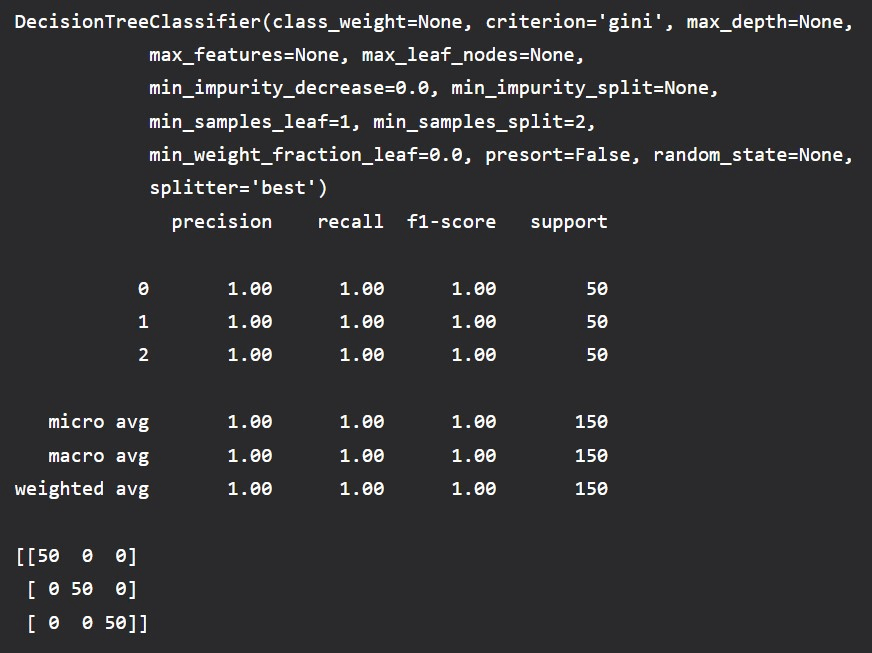
Example2:
from sklearn import datasets
from sklearn import metrics
from sklearn.tree import DecisionTreeClassifier
dataset = datasets.load_iris()
model = DecisionTreeClassifier()
model.fit(dataset.data, dataset.target)
print(model)
expected = dataset.target
predicted = model.predict(dataset.data)
print(metrics.classification_report(expected, predicted))
print(metrics.confusion_matrix(expected, predicted))
Output:
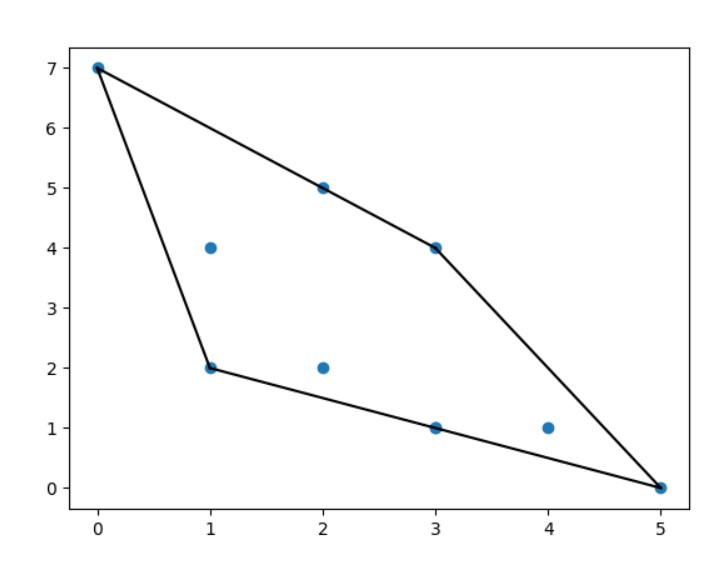
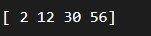
7. Scipy
Machine Learning developers use this library for the tasks which involve manipulation of image. It is very famous library for Machine Learning because there are many things for performing several tasks like linear algebra, statistics and others.
Example1:
import numpy as np
from scipy.spatial import ConvexHull
import matplotlib.pyplot as plt


points = np.array([
[2, 5],
  [3, 4],
  [3, 1],
  [2, 2],
  [4, 1],
  [1, 4],
  [5, 0],
  [3, 1],
  [1, 2],
  [0, 7]
])


hull = ConvexHull(points)
hull_points = hull.simplices


plt.scatter(points[:,0], points[:,1])
for simplex in hull_points:
  plt.plot(points[simplex,0], points[simplex,1], 'k-')


plt.show()
Output:
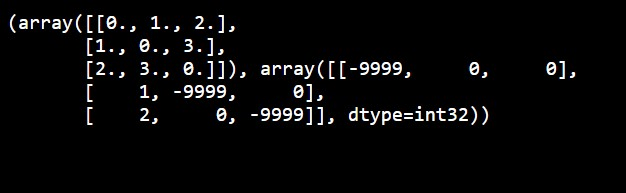
Example2:
import numpy as np
from scipy.sparse.csgraph import floyd_warshall
from scipy.sparse import csr_matrix
arr = np.array([
  [0, 1, 2],
  [1, 0, 0],
  [2, 0, 0]
])
newarr = csr_matrix(arr)
print(floyd_warshall(newarr, return_predecessors=True))
Output:
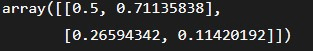
Example3:
from scipy.spatial import KDTree


points = [(1, -1), (2, 3), (-2, 3), (2, -3)]


kdtree = KDTree(points)


res = kdtree.query((1, 1))


print(res)
Output:
8. Tensorflow
This Machine Learning library was developed by brain team of Google. It is a very famous library in Python for Machine Learning development. It is an open source library. If you want to develop some artificial intelligence applications then you will need Tensorflow. It can be used for developing deep neural networks. For defining and performing computational tasks you should use this library.
Example1:
import tensorflow as tsf

K_1 = tsf.constant([2, 4, 6, 8])
K_2 = tsf.constant([1, 3, 5, 7])
result = tsf.multiply(K_1, K_2)

sess_1 = tsf.Session()
print (sess_1.run(result))

sess_1.close()
Output:
Example2:
import tensorflow as tf
# Initialize two constants
x1 = tf.constant([1, 2, 3, 4])
x2 = tf.constant([5, 6, 7, 8])
result = tf.multiply(x1, x2)
sess = tf.Session()
print(sess.run(result))
sess.close()
Output:
9. Theano
This is a very useful and powerful Machine Learning library. For computational tasks you can use this library. It is often used in long running projects where you need computational data very much. This library works very efficiently. It optimizes the use of CPU and GPU. It is used for self testing and detecting error. If you need to do mathematics and statistics then this library can help you very much.
Example1:
import theano
import theano.tensor as T
x = T.dmatrix('x')
s = 1 / (1 + T.exp(-x))
logistic = theano.function([x], s)
logistic([[0, 1], [-1, -2]])
Output:
Example2:
import numpy
import theano.tensor as T
from theano import function
x = T.dmatrix('x')
y = T.dmatrix('y')
z = x + y
f = function([x, y], z)
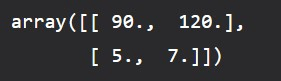
f([[30, 50], [2, 3]], [[60, 70], [3, 4]])Output:
Example3:
import numpy
import theano.tensor as T
from theano import function
x = T.dscalar('x')
y = T.dscalar('y')
z = x + y
f = function([x, y], z)
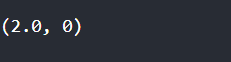
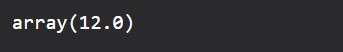
f(5, 7)Output:
10. OpenCV
It is a very famous Python library. We can use this for image processing. It has very much efficiency in computations. It is used in real time computers.
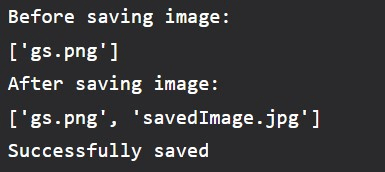
Example1:
import cv2
import os
image_path = r'C:\Users\Rish\Desktop\G\gs.png'
directory = r'C:\Users\Rish\Desktop\G'
img = cv2.imread(image_path)
os.chdir(directory)
print("Before saving image:")
print(os.listdir(directory))
filename = 'savedImage.jpg'
cv2.imwrite(filename, img)
print("After saving image:")
print(os.listdir(directory))
print('Successfully saved')
Output: