JavaFX Bar Chart
In the JavaFX application, in order to create Bar Chart, the BarChart class is used. The Bar Chart allows us to plot data along different bars to show the scales of each entity. All methods needed for this purpose are present in the javafx.scene.chart.BarChart class.
The constructor of the Bar Chart:
1. BarChart(Axis x, Axis y):
It is used to create the Bar Chart with specified x and y-axis.
2. BarChart(Axis x, Axis y, ObseravableList newlist):
It is used to create Bar Chart with specified x, y-axis, and specified new data.
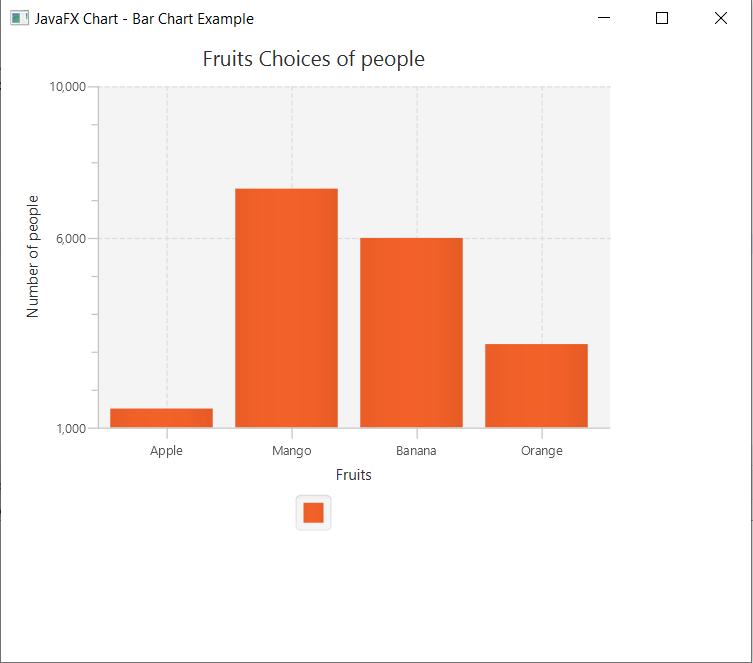
Charts in JavaFX applications- Bar Chart showing fruit choices of people:
Example:
import javafx.application.Application;
import javafx.scene.Group;
import javafx.scene.Scene;
import javafx.scene.chart.BarChart;
import javafx.scene.chart.CategoryAxis;
import javafx.scene.chart.NumberAxis;
import javafx.scene.chart.XYChart;
import javafx.stage.Stage;


public class ChartUI extends Application {


    @Override
    public void start(Stage primaryStage) throws Exception
    {
        String Apple = "Apple";
        String Mango = "Mango";
        String Banana = "Banana";
        String Orange= "Orange";

        CategoryAxis newxaxis= new CategoryAxis();
        NumberAxis yaxis = new NumberAxis(1000,10000,5000);
        newxaxis.setLabel("Fruits");
        yaxis.setLabel("Number of people");

        BarChart<String,Float> newbar = new BarChart(newxaxis,yaxis);
        newbar.setTitle("Fruits Choices of people");

        XYChart.Series<String,Float> series = new XYChart.Series<>();
        series.getData().add(new XYChart.Data(Apple,1500));
        series.getData().add(new XYChart.Data(Mango,7300));
        series.getData().add(new XYChart.Data(Banana,6000));
        series.getData().add(new XYChart.Data(Orange,3200));

        newbar.getData().add(series);

        Group root = new Group();
        root.getChildren().add(newbar);
        Scene scene = new Scene(root,600,500);
        primaryStage.setScene(scene);
        primaryStage.setTitle("JavaFX Chart - Bar Chart Example");
        primaryStage.show();

    }

    public static void main(String[] args) {
        launch(args);
    }
}
Output:
In order to create the Bar Chart in JavaFX, we have to import all the required libraries such as javafx.application.Application, javafx.scene.Group, javafx.scene.Scene, javafx.scene.chart.BarChart, javafx.scene.chart.CategoryAxis, javafx.scene.chart.NumberAxis, javafx.scene.chart.XYChart, javafx.stage.Stage.
Then we have created one class named ChartUI extending the Application class. Also, we have to override the start method to provide implementation details. This method creates an object of Stage as primaryStage. For the container to hold a Bar Chart, a BarChart object is created which is then passed to the Scene class object.
Bar Chart is created with the help of its constructor. XYSeries data is created and passed to the constructor.
The stage is prepared, the title is set and the show() method is called to display output. In order to run the application, the launch(args) method is invoked. In output Frame like container is displayed with the title, " JavaFX Chart – Bar Chart Example". Also, it displays a bar chart showing the number of people who likes a particular fruit.
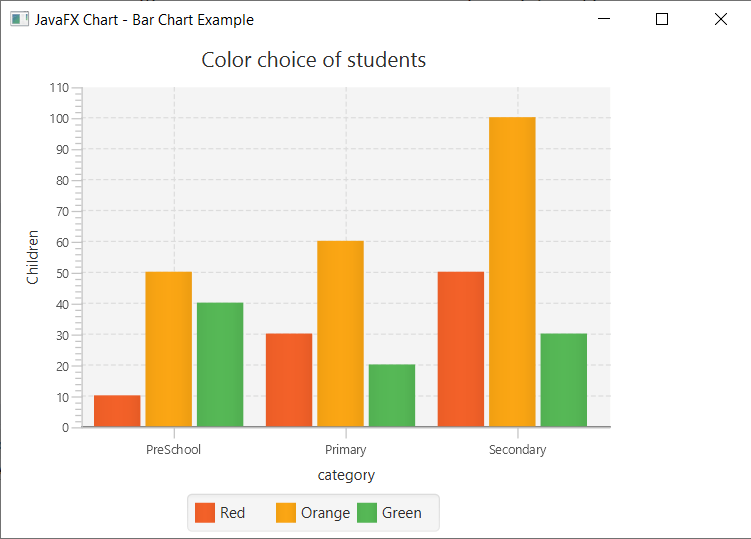
Charts in JavaFX applications – Bar Chart showing color choices of students:
Example:
import java.util.Arrays;


import javafx.application.Application;
import javafx.collections.FXCollections;
import javafx.scene.Group;
import javafx.scene.Scene;
import javafx.scene.chart.BarChart;
import javafx.scene.chart.CategoryAxis;
import javafx.scene.chart.NumberAxis;
import javafx.scene.chart.XYChart;
import javafx.stage.Stage;


public class ChartUI extends Application {


    @Override
    public void start(Stage primaryStage) throws Exception
    {
    CategoryAxis newxAxis = new CategoryAxis();
        newxAxis.setCategories(FXCollections.<String>
        observableArrayList(Arrays.asList("PreSchool","Primary","Secondary")));
        newxAxis.setLabel("category");

        NumberAxis newyAxis = new NumberAxis();
        newyAxis.setLabel("Children");

        BarChart<String, Number> newChart = new BarChart<>(newxAxis, newyAxis);
        newChart.setTitle("Color choice of students");

        XYChart.Series<String, Number> newseries1 = new XYChart.Series<>();
        newseries1.setName("Red");
        newseries1.getData().add(new XYChart.Data<>("PreSchool", 10));
        newseries1.getData().add(new XYChart.Data<>("Primary", 30));
        newseries1.getData().add(new XYChart.Data<>("Secondary", 50));

        XYChart.Series<String, Number> newseries2 = new XYChart.Series<>();
        newseries2.setName("Orange");
        newseries2.getData().add(new XYChart.Data<>("PreSchool", 50));
        newseries2.getData().add(new XYChart.Data<>("Primary", 60));
        newseries2.getData().add(new XYChart.Data<>("Secondary", 100));


        XYChart.Series<String, Number> newseries3 = new XYChart.Series<>();
        newseries3.setName("Green");
        newseries3.getData().add(new XYChart.Data<>("PreSchool", 40));
        newseries3.getData().add(new XYChart.Data<>("Primary", 20));
        newseries3.getData().add(new XYChart.Data<>("Secondary", 30));

        newChart.getData().addAll(newseries1, newseries2, newseries3);

        Group root = new Group(newChart);

        Scene scene = new Scene(root, 600, 400);
        primaryStage.setScene(scene);
        primaryStage.setTitle("JavaFX Chart - Bar Chart Example");
        primaryStage.show();

    }

    public static void main(String[] args) {
        launch(args);
    }
}
Output:
In order to create the Bar Chart with multiple bars in JavaFX, we have to import all the required libraries such as javafx.application.Application, javafx.scene.Group, javafx.scene.Scene, javafx.scene.chart.BarChart, javafx.scene.chart.CategoryAxis, javafx.scene.chart.NumberAxis, javafx.scene.chart.XYChart, javafx.stage.Stage.
Then we have created one class named ChartUI extending the Application class. Also, we have to override the start method to provide implementation details. This method creates an object of Stage as primaryStage. For the container to hold multiple Bar Chart, a BarChart object is created which is then passed to the Scene class object.
Bar Chart is created with the help of its constructor. XYSeries data is created and passed to the constructor.
The stage is prepared, the title is set and the show() method is called to display output. In order to run the application, the launch(args) method is invoked. In output Frame like container is displayed with the title, " JavaFX Chart – Bar Chart Example". Also, it displays a bar chart showing color choices of students learning in PreSchool, Primaary, and Secondary.