JavaFX Area Chart
In the JavaFX application, in order to create Area Chart, the AreaChart class is used. The Area Chart allows us to plot data along the XY plane. All methods needed for this purpose are present in the javafx.scene.chart.AreaChart class. JavaFX Area Chart is generally used to represent quantitative data. This chart is used to plot the area from given points. The Line Chart only joins the data point but the Area Chart highlights the area covered under the given points.
The constructor of the Area Chart:
1. AreaChart(Axis x, Axis y):
It is used to create the Area Chart with specified x and y-axis.
2. AreaChart(Axis x, Axis y, ObseravableList newlist):
It is used to create Area Chart with specified x, y-axis, and specified new data.
Property of the Area Chart:
1. createSymbols:
This property is the Boolean property when it is set to true it shows that the symbols can be created for given data items for those symbols nodes are not given. setCreateSymbols(Boolean value) method is used to set this property.
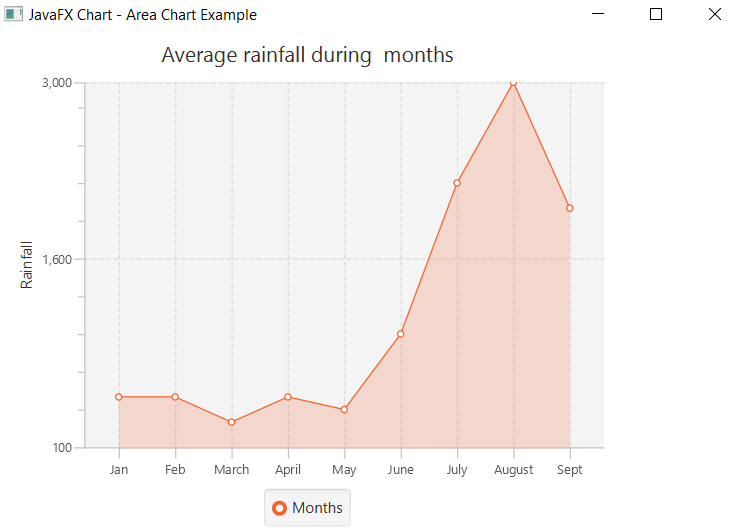
Charts in JavaFX applications- Area Chart showing rainfall along different months:
Example:
import javafx.application.Application;
import javafx.scene.Group;
import javafx.scene.Scene;
import javafx.scene.chart.AreaChart;
import javafx.scene.chart.CategoryAxis;
import javafx.scene.chart.NumberAxis;
import javafx.scene.chart.XYChart;
import javafx.stage.Stage;


public class ChartUI extends Application
{


    @Override
    public void start( Stage primaryStage ) throws Exception
    {
       CategoryAxis newxAxis = new CategoryAxis();

          //defining the y Axis
          NumberAxis newyAxis = new NumberAxis(100, 3000, 1500);
          newyAxis.setLabel(" Rainfall ");

          //Creating the Area chart
          AreaChart<String, Number> areaChart = new AreaChart( newxAxis, newyAxis );
          areaChart.setTitle(" Average rainfall during  months ");

          //Prepare XYChart.Series objects by setting data
          XYChart.Series series1 = new XYChart.Series();
          series1.setName(" Months ");
          series1.getData().add(new XYChart.Data(" Jan ", 500));
          series1.getData().add(new XYChart.Data(" Feb ", 500));
          series1.getData().add(new XYChart.Data(" March ", 300));
          series1.getData().add(new XYChart.Data(" April " , 500));
          series1.getData().add(new XYChart.Data(" May ", 400));
          series1.getData().add(new XYChart.Data(" June ", 1000));
          series1.getData().add(new XYChart.Data(" July ", 2200));
          series1.getData().add(new XYChart.Data(" August ", 3000));
          series1.getData().add(new XYChart.Data(" Sept ", 2000));


          areaChart.getData().addAll(series1);

          //Creating a Group object
          Group root = new Group( areaChart );

          //Creating a scene object
          Scene scene = new Scene( root, 600, 400 );
        primaryStage.setScene(scene);
        primaryStage.setTitle(" JavaFX Chart - Area Chart Example ");
        primaryStage.show();

    }

    public static void main(String[] args) {
        launch(args);
    }
}
Output:
In order to create the Area Chart in JavaFX, we have to import all the required libraries such as javafx.application.Application, javafx.scene.Group, javafx.scene.Scene, javafx.scene.chart.AreaChart, javafx.scene.chart.CategoryAxis, javafx.scene.chart.NumberAxis, javafx.scene.chart.XYChart, javafx.stage.Stage.
Then we have created one class named ChartUI extending the Application class. Also, we have to override the start method to provide implementation details. This method creates an object of Stage as primaryStage. For the container to hold an Area Chart, an AreaChart object is created which is then passed to the Scene class object.
Area Chart is created with the help of its constructor with the x axis and y axis passed n the constructor. XYSeries data is created and passed to the constructor.
The stage is prepared, the title is set and the show() method is called to display output. In order to run the application, the launch(args) method is invoked. In output Frame like container is displayed with the title, " JavaFX Chart – Area Chart Example". Also, it displays an area chart showing the rainfall along different months.