R Line Graphs
Line graph or line chart is a graph that connects a series of points by drawing segments between them. A line graph represents the relationship between 2 variables. These points are ordered in one of their coordinates (usually the x- coordinate) value. The plot() function is R is used to create the line graph.
Syntax:
plot(v,type,col,xlab,ylab)v is a vector containing the numeric values. type is used to set the value if it is ‘p’ then it draws only the points, if ‘I’ is used to draw the lines and if “o” then is used to draw both points and lines. xlab is the label for the x-axis ylab is the label for the y-axis main is the title of the chart col is for the color to both points and lines
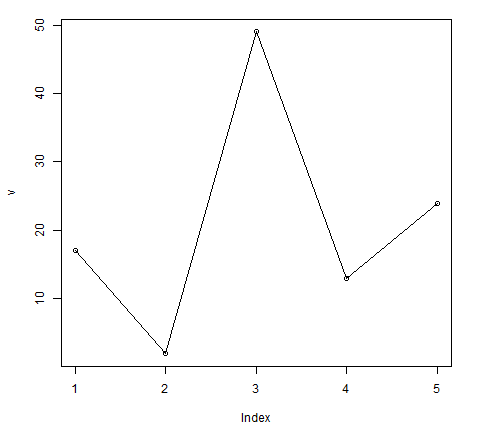
Example 1:
Let's create a simple line chart using the input vector and type parameter as “o”.
# Create the data for the chart.
v <- c(17,2,49,13,24)
# Give the chart file a name.
png(file = "line_chart.jpg")
# Plot the bar chart.
plot(v,type = "o")
# Save the file.
dev.off()
Output:
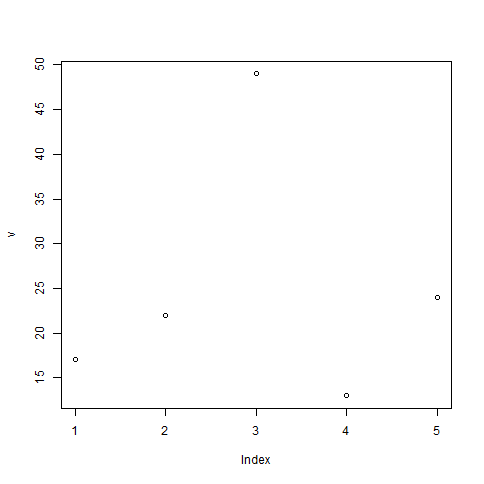
Example 2:
Let's create a simple line chart using the input vector and type parameter as “p”.
# Create the data for the chart.
v <- c(17,22,49,13,24)
# Give the chart file a name.
png(file = "line_chart_o.jpg")
# Plot the bar chart.
plot(v,type = "p")
# Save the file.
dev.off()
Output:
Line Chart with Title, Color, and Label
We can add more parameters to expand the feature of a line chart. We can add the color parameter, give the title to the chart and we can also add labels to the axes.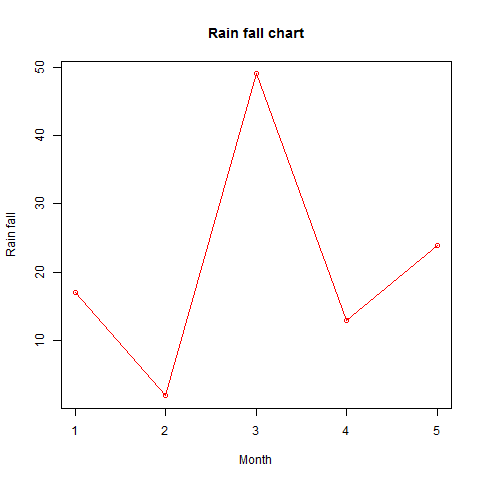
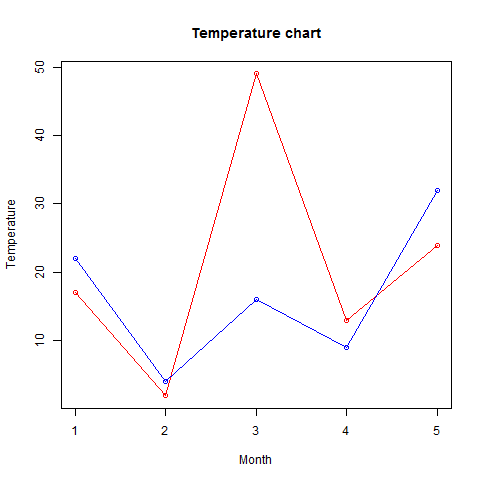
Multiple Lines in a Line Graph
We can draw more than one line on the same chart by using the lines() function. Let’s see an example.
Example:
# Create the data for the chart.
v <- c(17,2,49,13,24)
t <- c(22,4,16,9,32)
# Give the chart file a name.
png(file = "line_chart_2_lines.jpg")
# Plot the bar chart.
plot(v,type = "o",col = "red", xlab = "Month", ylab = "Temperature", main = "Temperature chart")
lines(t, type = "o", col = "blue")
# Save the file.
dev.off()
Output: