ER Diagram for University Database in DBMS
What is an ER diagram?
ER diagram, short for Entity Relationship Diagram, also known as ERD, is a diagram that shows the relationships of a set of entities stored in a database. In other words, ER diagrams help explain the logical structure of a database. ER diagrams are built on three basic concepts:
Entities, Attributes, and Relationships.
ER diagrams contain various symbols that use rectangles to represent entities, ellipses to define attributes, and diamonds to represent relationships. At first glance, an ER diagram looks a lot like a flowchart. However, ER diagrams contain many special symbols, the importance of which makes this model unique. The purpose of an ER diagram is to represent the Entity Framework infrastructure.
What is the ER model?
ER Model stands for Entity Relationship Model and is a high-level conceptual data model diagram. An ER model helps you systematically analyze your data requirements to create a well-designed database. An ER model represents real-world entities and the relationships between them. Creating an ER model in a DBMS is the best practice before implementing a database. ER modeling helps you systematically analyze your data requirements to create a well-designed database. Therefore, it is considered best practice to complete ER modeling before implementing the database.
Why use an ER diagram?
The main reasons for using ER diagrams are
- Helps define terminology related to entity-relationship modeling
- Provides a preview of how all the tables will be joined and what fields each table will contain
- Helps describe entities, attributes, and relationships
- ER diagrams can be converted into relational tables so you can quickly create databases
- Database designers can use ER diagrams to implement data in a particular software application.
- Database designers can better understand the information contained in the database with the help of ERD diagrams.
- ERD diagrams can be used to convey the logical structure of the database to the user
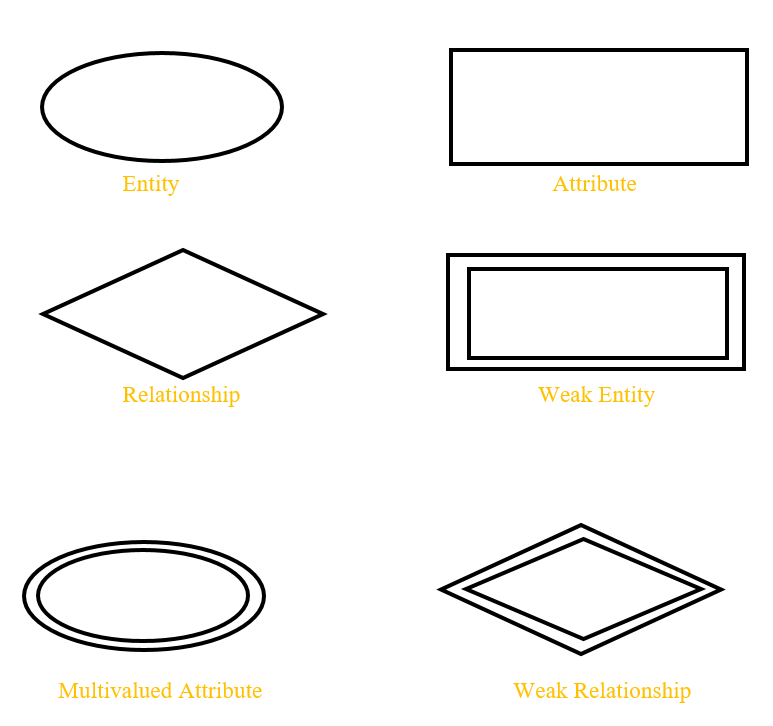
ER Diagram Symbols and Labels
Entity Relationship Diagram Symbols & Notations mainly contain three basic symbols, rectangle, oval, and diamond, representing relationships between elements, entities, and attributes. Based on the ERD diagram's main element, there are several sub-elements. An ER diagram is a visual representation of data that shows how it relates to each other using various ERD symbols and notations.
Below are the main components of ER diagram and their symbols.
Rectangle: This icon in the entity relationship diagram represents the entity type
Ellipse: This icon represents attributes
Diamond: This icon represents the relationship type
Line: Link attributes to entity types and link entity types to other relationship
types.
Primary key: Attributes are underlined
Double Ellipse: Represents a multivalued attribute
Components of an ER diagram
This model is based on three basic concepts:
- Entity
- Attribute
- Relationship
Entity
An entity is a person, place, event, or object associated with a particular system. For example, a school system may include students, teachers, core courses, subjects, fees, and other elements. Entities are represented in ER diagrams by rectangles and named with singular nouns.
Weak entity
A weak entity is an entity that depends on the existence of another entity. Technically, it can be defined as an entity that its attributes cannot identify. A foreign key is combined with its attributes to form a primary key. Entities like order lines are a good example of this. If there is no order, there is no meaning for the ordered product, so it depends on whether or not there is an order.
Attribute
Attributes are properties, characteristics, or characteristics of entities, relationships, or other attributes. For example, the Inventory Item Name attribute is an attribute of the Inventory Item entity. Entities can have any number of attributes. On the other hand, attributes can also have their specific attributes. For example, the Customer Address attribute can contain Street, Street, City, and State attributes. These are called compound attributes. Note that some top-level ER diagrams do not show attributes for simplicity. However, attributes are represented by an ellipsis.
Attributes of value
If an attribute can have multiple values, it is called a multivalued attribute.
Note that this is different from attributes, which have their attributes. For example, a teacher entity can have multiple subject values.
Derived attribute- An attribute that is based on another attribute. For example, the area of a circle can be derived from its radius.
Relationship
Relationships describe how entities interact. For example, a Carpenter entity can be related to a Table entity through a relationship "Build" or "Create". Relationships are represented by diamonds and indicated by verbs.
When the same entity participates in a relationship multiple times, it is called a recursive relationship. Relations are typically displayed as diamonds or labels directly on the connection lines.
Cardinality and order
These two further define the relationship between entities by putting the relationship in a numerical context. For example, an email system can have multiple contacts in one account. In this case, the relationship follows a "one-to-many" model. There are several notations used to represent cardinality in ER diagrams. Chen, UML, Crow, and Bachman are common notations.
Benefits of ER diagrams
ER diagrams form a very useful framework for creating and working with databases. First, ER diagrams are easy to understand and do not require extensive training to operate efficiently and accurately. This means a designer can use ER diagram to communicate easily with developers, customers, and end-users regardless of their IT skills.
ER diagrams can then be easily transformed into relational tables that can be used to build databases quickly. In addition, database developers can use ER diagrams directly as blueprints for implementing data into specific software applications. Finally, ER diagrams can also be applied in other contexts, such as describing various organizational relationships and operations.
Tips for effective ER diagrams
- Ensure that each entity appears only once per diagram.
- Name each entity, relationship, and attribute in the diagram.
- Explore relationships between entities. Eliminate all redundant relationships.
- Do not interconnect relationships.
- Use color to emphasize important parts of your chart.
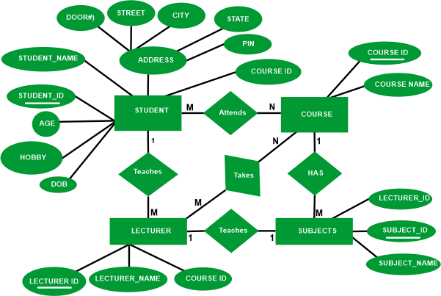
ER diagram for University Database
University databases store details about undergraduates, the courses, the semesters in which they have taken a particular course (and grades and grades if they have completed the course), and the degree programs in which each student is enrolled. This database is not suitable for a large university, but it presents interesting connections to the question.
Creating an ER diagram is crucial for understanding the information system under development. A database has many facets, and it can be challenging to track them all. ER diagrams help you place all related entities in an easy-to-understand format and keep track of the entities and their relationships.
College databases must track large amounts of data about each student, faculty member, course changes, and more. You can start with an ER diagram to ensure your database is dynamic and fully represents all this.
ER diagrams model all your data and help you understand the needs of your database management system. ER diagrams can be used to identify problems quickly at an early stage. ERDs allow you to develop well-designed databases.
If you need help figuring out where to start with your university's database ERD, choose from the following examples and templates.
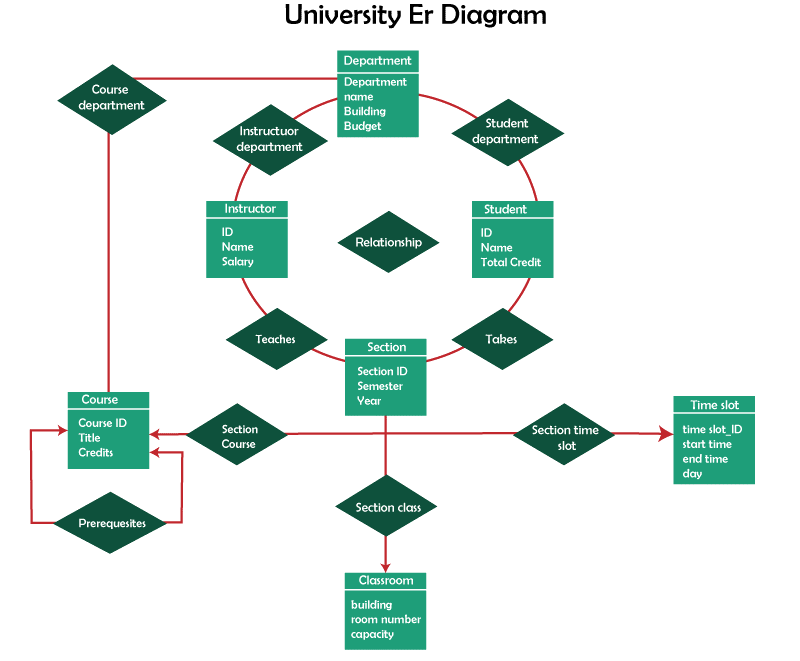
Example 1
This editable template details all the information flowing through the database. The database records information for all units, including students, faculty and courses. This template organizes everything by department, making it ideal for colleges with many departments.
ERD for university databases
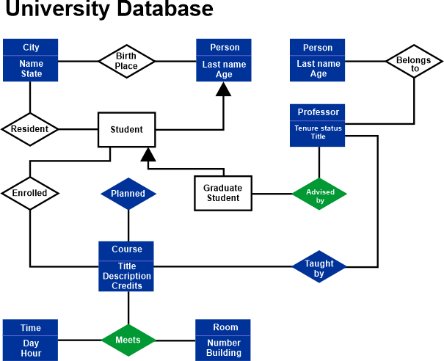
Example 2
This is another ER diagram for a university database. This ERD is more program oriented. The focus is on student information, and the programs students have enrolled in. This ERD covers the academic aspects of the database and collects data to track each student's performance.
Example 3
Here's another template for creating an ERD for a university. This ERD is intended for multiple users, such as students, teachers and administrators. It also includes various departments, courses and programs. This ERD template is for you if you want a detailed university database.
Consider the subsequent listing of requirements.
- Universities provide one or extra programs.
- A software includes one or extra publications.
- Students need to be enrolled withinside the software.
- Students take publications which are a part of a software.
- Programs have a name, a program identifier, total credits required for completion, and a start year. A course has a name, course ID, credit value, and start year.
- A student has one or more first name, last name, student ID, date of birth, and first year of enrollment. You can consider every first name as a single object (for example, "John Paul").
- When a student enrols in a course, the year and semester are noted.
- The year and semester taken are recorded when a student takes a course. When you complete the course, your grade (e.g. A or B) and grade (e.g. 60%) will be recorded.
Problem
Drawing ER model of university database application considering constraints –
• There are numerous departments at a university, and each department has numerous instructors (one is her HOD). HOD in this context refers to the department head.
• A lecturer is only a member of one department.
• Each department offers a variety of courses, and one of its instructors teaches each subject.
Entities of ER diagrams in university databases
- University student
- Department
- Class
- Factorial and conversion to table
Students have a unique ID, can be enrolled in multiple classes, and have at most one major course.
A faculty must belong to one department, and a faculty can occupy multiple classes
Each student receives a grade for the class they enrolled in.
How can we make an ERD for a database at a university?
Now that we've covered all the constraints involved in designing a university database, it's time to plan the ER diagram for the university database.
Step 1:
Identify all entity sets that will be part of the database. Here are some examples: You can add more if you want.
- University student
- Department
- Course
- Teacher
Step 2:--
After identifying all the entities, you need to assign attributes to them. Attributes describe an entity and help identify it within an entity set. We have listed some attributes of these entities:
University student:
Student ID number, student ID number, admission date, batch
Department
Name and location of the department
course:
course number, title, number of credits, length, and prerequisites
teacher:
Instructor ID, instructor name, email address, room number, phone number
Step 3:
The next step is to identify the important attributes of the entity set. A key or primary attribute is unique to each entity within an entity set. Student ID is the primary attribute of a student.
• The department name is the main attribute of the department.
• The instructor ID is unique for each instructor. A course code is a key attribute for each course.
• Departments offer multiple courses, and each course belongs to only one department.
Multiple students enroll on courses and one student for multiple courses. So there are too many relationships.
- The teacher-student relationship is not defined for the following reasons
- There are numerous lecturers in one department, and each lecturer is a member of just one department, creating a one-to-many relationship.
- There is a "HOD" for each department, and the instructor is only the "HOD" for one department, therefore there is a one-to-one interaction. HOD in this context refers to the department head.
- Courses and instructors have a many-to-one relationship because one teacher teaches many courses, but many instructors teach many courses.
- Relationships have no meaning.
- This relationship can always be derived indirectly through courses and faculty and courses and students.
Step 4:
You must determine the relationships between the entities after listing the entities and their properties. For instance, because one department provides numerous courses, there is a one-to-many link. The department has a variety of courses.
A course can have multiple students enrolled in it, and a student can be enrolled in another course, so there are too many relationships.
There may be many participants in a course. One can have more than one instructor, but an instructor can only belong to one department. This is just one of several connections. One department is the lecturer's exclusive affiliation. Courses are taught by one of instructors, albeit one instructor may teach more than one course.
This is a one-to-many relationship.
Although we have identified the relationships between most entities, it is important to note that there are no significant relationships between students and teachers. It is therefore not named specifically. The relationship between the course-student or course-instructor can be used to indirectly determine the student-instructor relationship.
Step 5:
The final step is to create the ER diagram. Entities and their relationships have already been identified.
You may add more entities that are part of your database, like admin, and identify relationships to add them to your ERD. With these few easy steps, you can create your ERD for any information system you like.