Er Diagram Symbols and Notations in DBMS
Entity Relationship Diagram
Entity Relationship Diagrams, or ER Diagrams for short, are diagrams that show the relationships among entity sets that are stored in databases. Alternatively said, ER diagrams assist in describing the logical layout of databases. Entities, attributes, and relationships are the three fundamental ideas on which ER diagrams are based. Entities, traits, and relationships are all represented as rectangles, ovals, and diamond shapes in ER diagrams.
At first impression, a flowchart and an ER diagram are similar. The ER Diagram is a particular model, nevertheless, because of the multiple specific symbols and their associated meanings. The entity framework architecture is shown in the ER Diagram. The relationship between the entities that will be recorded in a database is shown in an entity relationship diagram (ER Diagram). The ER Diagram illustrates how a database is structured. With the aid of specialised symbols, it serves as a foundation for defining the connections between database entities. Entities, attributes, and relationships make up the core three elements of an ER diagram.
The relationship between the objects Student and Course is depicted in the diagram below. A student and a course have a many-to-many relationship since different students may choose the same course and a student may choose multiple courses. Stu Id, Stu Name, and Stu Age are characteristics of the student object. Aspects of the course object include Cou ID and Cou Name.
Entity Symbols in ER Diagram
The ER Diagram illustrates how a database is structured. With the use of specialized symbols, it serves as a foundation for defining the connections between database entities. Any physical thing that contributes to the fundamental framework of a database might be considered an entity. A person, a tree, a company, an occasion, or any other living or non-living thing can be considered an entity.
The modeler can use IDEF0 to define the functions as an analysis tool. The duties involve doing the necessary tasks, ensuring the accuracy of the current system, and identifying any holes in it.
Entity
There is a rectangle around the name of this fundamental item.
Weak entity
This thing's complexity prevents it from being recognized only by its features (due to the absence of a primary key). It frequently inherits the identity of the parent entity by fusing it with a portion of the key.
Associative entity
An associative entity is frequently used in many-to-many relationships and refers to all of its connections as being "many."
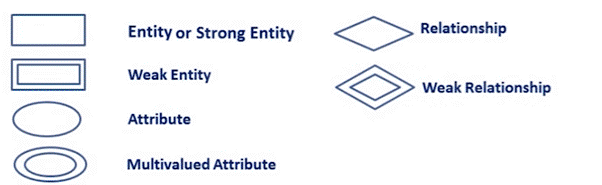
Relationship Symbols in ER Diagram
Relationships in an ER diagram would only describe the connections between two or more objects.
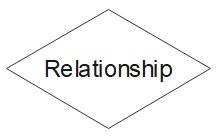
Strong Relationship:
A single rhombus with the relationship's name inside represents a strong relationship. An entity is regarded as independent in this case if none of its children's primary keys also contain the primary key of the related object.
Weak or Identifying Relationship in ER Diagram:
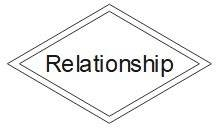
The double rhombus that surrounds the name represents a poor relationship. The child entity is reliant on the parent entity in this case because a piece of the parent entity's primary key is contained in the child entity's main key.
Attribute Symbol in ER Diagram
In any collection of ER diagram symbols, you can find all different kinds of attributes that would specify the value or property of any entity. If, for instance, a pen is an entity, then its attributes might include its color, size, composition, and so on.
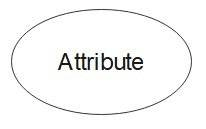
Attribute:
To represent a fundamental attribute, its name is written inside a single oval.
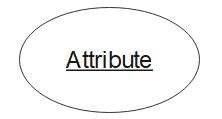
Key Attribute:
This distinctive characteristic is used to distinguish one entity from others. It is symbolized by an oval with the name italicized.
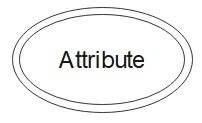
Multi-valued Attribute:
These are the attributes that are represented by a double oval and can have more than one value (for example, the Name attribute can have both the First and Last name).
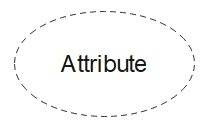
Derived Attribute:
A derived attribute might not be physically present in the database and could be logically derived from any other attribute (represented by a dotted oval).
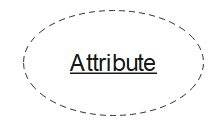
Weak Key Attribute:
The attribute might be derived from any other attribute and would have unique IDs for the entity. It is represented by an ellipse with a line through it.
Inheritance Symbol in ER Diagram
The inheritance between child and parent entities must also be taken into account when discussing the symbols used in entity-relationship diagrams. The inheritance for a relationship between entities could be idealized versions of these.
Partial participant:
It is indicated by a single line that not all of the objects in the collection are participants in the relationship.

Total Participation Symbol:
This indicates a relationship between every entity in the set and is represented by a double line.
Optional Participation:
This is represented by the dotted lines, as the name suggests it is used as an optional parameter.
ER Diagrams Using Crow's Foot Notation
As you can see, a database's structure and model can be represented using any number of entity-relationship diagram notations. However, there are other Crow's Foot notations that might assist you in illustrating the distinction and connection between various things (known as Cardinality).
Three key symbols that can be used to represent cardinality in the Crow's Foot idea are:
- A zero-signifying ring
- The symbol for one, a dash.
- A Crow's Foot with various meanings.
The overall cardinality in our database can be represented by pairing these ER diagram symbols in various ways. In these graphs, the inner component represents the lowest value, while the outside component represents the highest value.
Each to one
One entity from set A may only be associated with a maximum of one entity from set B in what is also known as a "Mandatory One" relationship. One student, for instance, may sign up for multiple courses, but each course may only have one registered user.
Many to One
This allows for the association of one entity from set A with numerous entities from set B. Consider a class; different students may be enrolled in different classes. An Optional One cardinality is another name for it.
One to Many
As a result, several entities from Set A can have relationships with just one from Set B. For instance, several students may be enrolled in the same class.
Many to many:
Last but not least, more than one entity from Set A can be related to more than one entity from Set B in this cardinality. For instance, different professors may be assigned different pupils in a class.
Marked by Barker
This notation, created by Richard Barker, is most frequently used to describe data in Oracle. Most people who are familiar with diagrams have seen Barker's notations before because they are so commonly used.
Symbols for Barker's Notation
Entities are represented by rounded-corner rectangles, attributes are represented by one of three symbols inside the entity box, and relationships are represented by a variety of lines.
One of three approaches can be used to display attributes:
- Unique identification, denoted by the pound sign (#)
- Asterisks (*) denote attributes that must be present.
- Optional: Denoted by the letter "O"
Each relationship line conveys two things to the reader since relationships are designed to reflect both optionality and degree.
Alternative symbols
- Mandatory relationship: A clear, unwavering line
- Relationship that is optional: A dashed line
Conclusion
Entity Relationship Diagrams, or ER Diagrams for short, are diagrams that show the relationships among entity sets that are stored in databases. Alternatively said, ER diagrams assist in describing the logical layout of databases. Entities, attributes, and relationships are the three fundamental ideas on which ER diagrams are based. Entities, traits, and relationships are all represented as rectangles, ovals, and diamond shapes in ER diagrams.
At first impression, a flowchart and an ER diagram are similar. The ER Diagram is a particular model, nevertheless, because of the multiple specific symbols and their associated meanings. The entity framework architecture is shown in the ER Diagram. The relationship between the entities that will be recorded in a database is shown in an entity relationship diagram (ER Diagram). The ER Diagram illustrates how a database is structured.
You're all set! Following this guide should enable you to become familiar with the various ER diagram symbols. As you can see, there are many different Entity-Relationship Diagram symbols and notations that may be used to produce a huge variety of drawings. You can easily build entity-relationship diagrams, flowcharts, organizational charts, and much more with the help of a professional diagramming tool like EdrawMax Online using simple drag-and-drop choices. Thousands of components are available in the web application, which is free and can satisfy your diagramming requirements.