
×

Red-Black Tree Visualization in DBMS

Introduction to Red Black Tree

A red-black tree is a self-balanced binary search tree with an extra bit per node, usually read as a color (red or black). The tree is balanced with these colors during insertions and deletions. Although not perfectly balanced, the tree is good enough to reduce search time and bring the value closer to O (log n), in which n represents a wide variety of tree members. This tree was invented by Rudolf Bayer in 1972.

Note that these trees have the same memory footprint as traditional (non-colored) binary search trees. This is because each node only needs 1 bit of memory to store the color information.

 The tree is balanced using red and black colors. Due to node color constraints, simple root-to-leaf paths can be twice the length of other such paths. Red-black trees retain the ability to self-balance.

  • The root of a red-black tree must always be black.
  • There can never be two adjacent red nodes in a red-black tree.
  • Each node must either be red or black (a red node cannot have a red parent node or a red child node). The number of black nodes on each path from a node (including the root) to any of its NULL nodes in its descendants is the same.
  • There are only black leaf nodes.

Features of Red-Black Tree

  • The color of the root node should always be black.
  • Zero children of all nodes in a red-black tree are black.
  • Descendants of red nodes are black. The black node could be the parent node of the red node.
  • Each sheet has the same black depth.
  • All direct connections from the root node to (downward) leaf nodes have the same number of black nodes.
  • Tree roots are black.
  • Whole leaves are black.
  • Red nodes never have two consecutive red nodes because the descendants of red nodes are always black.
  • The same black nodes appear in each straight path from a node to a descending leaf.

Visualization of Red-Black Tree

Visualization of Red-Black tree structures offers a simple representation of time and place.

The act or process of interpreting data into visual terms, such as images, graphs, or simulations, is known as visualization. An abstract or complicated concept can be communicated more clearly through visualization.

Tree analysis included multidimensional (3D) and continuous multilevel (CMP) spatial models of distributions. Both one-dimensional and multidimensional (NDS) analysis were performed along standard parameters during multispectral sampling (MSM). All analyses used the R package in the previous work to create visualization plans. An optional variable was added to each visualization plan included in the visualization algorithm as a result of the study data. The multilevel modeling model was developed to reflect that we have always used 3D models. All results are expressed as the mean squared error of the visualized data.
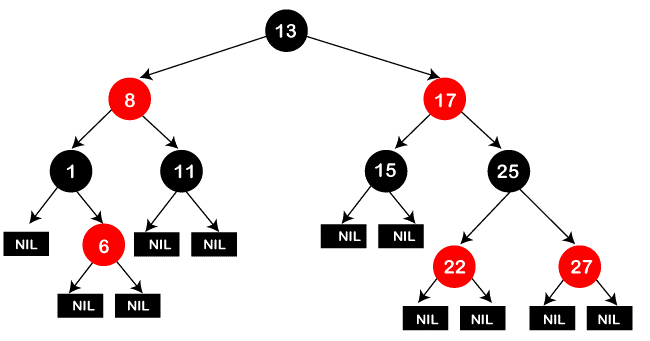
Red-Black Tree Visualization

An element must be added using the following procedure to a red-black tree: 

  1. Verify whether the tree is empty.
  2. Add a new node as the root node in Black and complete the process if the tree is empty.
  3. Paste the new node as a red leaf node if the tree is not empty.
  4. If the new node's parent is Black, terminate the operation.
  5. If the new node's parent is red, check the color of the new node's parent's siblings. 
  6. Do the appropriate rotation and change the color for black or null nodes.
  7. For red nodes, Recolor and Recheck. Repeat the same until the tree is a red-black tree.

To delete an element to a red-black tree, we have to follow the following algorithm:

  1. First, find the item you want to remove.
  2. Replace the node with the node holding the largest element in the left subtree if the element to be deleted is in a node with only the left children. (This node lacks the proper children.)
  3. Replace the node with the node containing the smallest element in the right subtree if the element to be deleted is in a node with only the right children (this node has no left child).
  4. If the element to be removed is in a node with left and right children, swap them in one of the two ways above. When replacing, replace only the value, not the color. 
  5. The element to remove has exactly one left or right child. Replaces this node with its only child. 
  6. This could violate the red constraint or the black constraint. Red constraint violations are easy to fix.
  7. If the removed node is black, it violates the black constraint. If we remove the black node y, all paths containing y will have one less black node.
  8. Next, it encounters two cases.
  9. Replacement nodes are red. In this case, we color black to compensate for the loss of black nodes.
  10. Exchange nodes are black.

Related Topics

Advantages of DBMS

A Database Management System (DBMS) is a collection of programs which lets the end-users to manage and control the database. Database systems use query language for accessing, storing, and maintaining the...

3 minutes read.

Database for library management system

The database can be considered the container where the data or information can be stored electronically in a computer system. Most mobile applications and websites run our day-to-day activities by...

5 minutes read.

Why we need Distributed Database Management System

Assuming there is a very strong single machine having properties like: Heaps of memory.Gigantic measure of dependable stockpiling with very quick I/O.Incredible handling rate and processing power (10s, 100s and might...

4 minutes read.

Red-Black Tree Visualization in DBMS

Introduction to Red Black Tree A red-black tree is a self-balanced binary search tree with an extra bit per node, usually read as a color (red or black). The tree is...

4 minutes read.

3- Tier Architecture in DBMS

Three-tier architecture is an application software architecture that arranges the output into three parts or tiers that are:  the presentation tier, where the user interacts with the application; the application...

4 minutes read.

ER Diagram for Student Management System in DBMS

Entity Relationship diagrams Entity Relationship Diagrams, or ER Diagrams for short, are diagrams that show the relationships among entity sets that are stored in databases. Alternatively said, ER diagrams assist in...

6 minutes read.

Concurrency Control Protocols

Concurrency Control Protocols Concurrency control protocols ensure the atomicity, serializability and isolation of the concurrent transactions. The Concurrency control protocols can be broadly classified into the following categories: Lock Based ProtocolTimestamp protocol Lock Based Protocol In this protocol,...

5 minutes read.

What is a Database

A database is a structured collection of data that is often kept electronically on a computer system. Typically, a database is managed by a database management system (DBMS). Together, the...

9 minutes read.

Components of Relational Database Management System

A relational database management system compromises various component. Tables, records, attributes, instances, schemas and keys together form a relational database. In this page, we will discuss each component of RDBMS in...

4 minutes read.

Fragmentation in Distributed DBMS

Fragmentation is a course of isolating the entire or full information base into different sub tables or sub relations with the goal that information can be put away in various...

4 minutes read.

Advantages of Database Management System in DBMS

A database management system (DBMS) is a software tool that provides an interface for managing data stored in a database. Some advantages of using a DBMS include: data integration, data...

3 minutes read.

DBMS Languages

User can access, update, delete, and store data or information in the database using database languages. The following are the databases languages in the database management system: Data Definition Language Data Manipulation...

3 minutes read.

Constraints in Database Management System

In a database management system, certain constraints are applied while performing any operation on the database to ensure that the integrity and quality of the data are maintained throughout the...

4 minutes read.

Super Key in DBMS

Super Key in DBMS: The super key is a column or a set of columns in the database table, which uniquely identifies the tuple or row of the same table....

2 minutes read.

ER Diagram of Company Database in DBMS

Entity Relationship Diagram Entity Relationship Diagrams, or ER Diagrams for short, are diagrams that show the relationships among entity sets that are stored in databases. Alternatively said, ER diagrams assist in...

3 minutes read.

DBMS Architecture

This is the first step when creating a database management system. The architecture of a database management system plays an important role in determining the actual design and layout of...

4 minutes read.

Relational Integrity Constraints

Relational Integrity Constraints are the set of rules that can be used to maintain the data integrity during an insert, delete and update operations into a table. These constraints are checked in the...

2 minutes read.

Domain Constraints in DBMS

Introduction about DBMS:- DBMS stands for DataBase Management System. DBMS(DataBase Management System) is a type of software by which we can save and retrieve the user's data with the security process....

3 minutes read.

Advantages of B-Tree in DBMS

A self-balancing search tree is the B-Tree. It is assumed that everything is in the main memory in most other self-balancing search trees (such as AVL and Red-Black Trees). We must...

3 minutes read.

B+ (Plus) Tree in DBMS

What is a B+ tree? The B+ tree is known as a balanced binary search tree. in this tree, we can store the data in the form of nodes. B+ tree...

9 minutes read.