ER Diagram for Student Management System in DBMS
Entity Relationship diagrams
Entity Relationship Diagrams, or ER Diagrams for short, are diagrams that show the relationships among entity sets that are stored in databases. Alternatively said, ER diagrams assist in describing the logical layout of databases. Entities, traits, and relationships are all represented as rectangles, ovals, and diamond shapes in ER diagrams.
At first impression, a flowchart and an ER diagram are similar. The ER Diagram is a particular model, nevertheless, because of the multiple specific symbols and their associated meanings. The entity framework architecture is shown in the ER Diagram. The ER Diagram illustrates how a database is structured. With the aid of specialized symbols, it serves as a foundation for defining the connections between database entities. Entities, attributes, and relationships make up the core three elements of an ER diagram.
The relationship between the objects Student and Course is depicted in the diagram below. A student and a course have a many-to-many relationship since different students may choose the same course and a student may choose multiple courses. Stu Id, Stu Name, and Stu Age are characteristics of the student object. Aspects of the course object include Cou ID and Cou Name.
The relationship between entities in a table is depicted using an E-R (Entity-Relationship) diagram. ER diagrams show how logically organized databases are. Relationships between two database tables are represented by an ER diagram. Entity Relationship Diagram, or E-R diagram. Entity is a system object, commonly referred to as a database table. The e-r diagram shows the relationships between the various database tables. An entity is represented by an E-R diagram together with its characteristics, which are its properties. All of the table's columns are treated as attributes if the object is assumed to be a database table.
Er Diagram for Student Management System
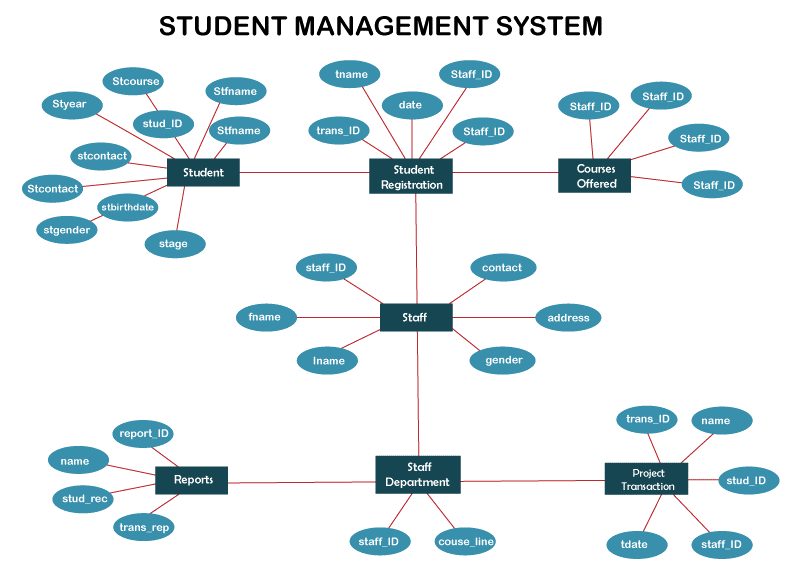
The overarching entities in the student management system are depicted in this ER diagram. The qualities of the entities are represented by circles or ovals, whereas the entities themselves are displayed as rectangles.
The entities are shown in this ERD's rectangle shape. However, each entity's associated circle displays each characteristic as a circle. The example also represents the first database design for the system. ERD's main goal is to help users comprehend how the admin interface is structured.
ENTITIES and their ATTRIBUTES
Student information includes stud ID (PK), stfname, stlname, stcourse, styear, stcontact, stage, stbirthdate, and stgender.
- Offerings: course ID (PK), course desc, units, and course remarks
- Personnel: staff ID (PK), fname, lname, contact, address, and gender
- Employee Department: employee ID (PK), course line
Reports include report ID (PK), reports name, student records, and transaction reports.
Registration ID (PK), name, content, and registration date for students
Project transactions include the following: transaction ID (PK), transaction name, student ID, staff ID, and transaction date.
Creating student management system Er diagram:
Simply gather the information that has to be kept in the system and use that to build the ER diagram. After that, generalize these data and establish their properties, all of which need to be connected to the kind of entity. The system's database cannot be used in the same way as the example provided. A database design is necessary because of this.
ER Diagrams must be used to model the data kept in a database. It serves as the foundation for a database. The ER diagram thus aids in illuminating the many kinds of data that will be kept in the student management system. The organization of data in accordance with a database model is known as a database design (data model). The designer specifies the connections between the data elements that must be saved. This also enables them to start adjusting the data to the database model.
Why do we need to create the Er diagram for student management system?
- Create subject-based tables using your data to prevent information duplication.
- Provides access to the data required to link the tables as required.
- Supports and helps to ensure the integrity and correctness of your data.
Designing Databases using Tables
The tables that follow cover every aspect of the Student Management System's database design, including field names, descriptions, data types, and character lengths.
These roles are specifically utilized to organize each piece of data provided into the system. This ensures that the data were properly maintained and protected.
The back end of the student management system was designed using each of the database tables.
ER Diagram construction steps for the student management system
Learn about the ER diagram in step one (Entity Relationship Diagram)
The organization of data types in a project is displayed in the entity relationship diagram. It employs symbols to make its components and connections clear.
Before you construct the ER Diagram, you must also become familiar with their symbols and applications.
ER diagram symbols include the following:
- Fields: Fields are the elements of a table that specify an entity's attributes.
- Keys, a method for classifying data properties. It helps users model their databases to make sure they are effective and organizes ER diagrams.
- Primary Key: Identifies a single instance of an entity, i.e., a special attribute or set of characteristics
- Foreign key: When data attributes have one-to-many associations with one another entities, a foreign key is created.
Step 1: Select the intended audience
After being familiar with the symbol, you must decide who you want to reach. Your project will be used by your chosen audience.
Step 2: Examine the entities and the attributes they contain.
When developing an ER diagram, analysis is crucial. You'll be able to comprehend how the diagram functions and steer clear of mistakes as a result.
The user data collected was really helpful in generating the diagram. You will assess the facts and select the most pertinent ones.
Plot the entity relationship diagram in step four.
You will need the entities, their properties, and relationships in order to plot the ERD. To create an accurate entity relationship diagram, you will base the data structure on the information that has been reviewed.
Determine the targeted users in step two.
You must decide who your target users are after being familiar with the symbols. The people who use your project will be your targeted audience.
Step 3: Examine the entities and all of their properties.
The creation of an ER diagram requires thorough analysis. It will assist you in comprehending the diagram's function and preventing undesirable mistakes.
In order to create the diagram, the user information collected is quite helpful. You will assess the information and choose the most pertinent pieces.
Entity Relationship Diagram (ERD) Plotting, Step 4
The entities, their qualities, and their relationships are necessary to plot the ERD
The entity relationship diagram and database architecture are two distinct examples with different target audiences. These two express the same notion yet the idea is delivered differently. Be aware that the example diagrams show how the student management system project is structured. It can be altered, nevertheless, to better suit the requirements of your users. However, the examples themselves serve the objective of explaining how the system's data store functions to the audience. It lists the entities (data store) of the system, together with their characteristics and their connections.
Conclusion
The overarching entities in the student management system are depicted in this ER diagram. The qualities of the entities are represented by circles or ovals, whereas the entities themselves are displayed as rectangles.
The entities are shown in this ERD's rectangle shape. However, each entity's associated circle displays each characteristic as a circle. The example also represents the first database design for the system. ERD's main goal is to help users comprehend how the admin interface is structured. Entity Relationship Diagrams, or ER Diagrams for short, are diagrams that show the relationships among entity sets that are stored in databases. Alternatively said, ER diagrams assist in describing the logical layout of databases. Entities, traits, and relationships are all represented as rectangles, ovals, and diamond shapes in ER diagrams.
ER diagrams show how logically organized databases are. Relationships between two database tables are represented by an ER diagram. Entity Relationship Diagram, or E-R diagram. Entity is a system object, commonly referred to as a database table. The e-r diagram shows the relationships between the various database tables. An entity is represented by an E-R diagram together with its characteristics, which are its properties. All of the table's columns are treated as attributes if the object is assumed to be a database table.