Flowchart in C
“A flowchart is a diagram that shows how a system process works. It employs various forms and symbols to represent the multiple processes, choices and actions involved in the process. we can comprehend and explain how information or control moves through a system visually using flowcharts.”
Flowcharts are frequently employed in many forms of disciplines, including software development, business process modeling, system analysis, and problem-solving. They aid in analyzing, designing, and documenting processes or algorithms, making them simpler to comprehend, share, and use.
Types of flowcharts:
- is a flowchart layout in which the connecting arrows and symbols are positioned horizontally from left to right. This design is frequently employed when the Flowchart must fit within a horizontal space or when the process flows organically from left to right.
- The phrase "panoramic flowchart" is not frequently used when creating flowcharts. It could describe a flowchart with an expansive form that offers a comprehensive overview of a procedure and enables a bird's-eye view of the complete process flow.
- This is a flowchart layout in which the connecting arrows and symbols are organized vertically from top to bottom. This design is frequently used when the Flowchart must fit vertically or when the process flows organically from top to bottom.
- : a visual representation of the architecture or organization of a software system. It demonstrates the various system modules or parts and how they relate. It focuses on the relationships and high-level organization between the different software components.
Flowchart Symbols:
A flowchart's various elements and actions are represented graphically by flowchart symbols.
Following are some typical flowchart symbols:
Terminal Symbol: It denotes the start or finish of a process or Flowchart. Usually, an oval or rounded rectangle form is used to symbolize it. The Flowchart's beginning has the designation "Start" or "Begin." At the Flowchart, it is marked with the words "End" or "Stop."
The terminal symbol aids in visually identifying the Flowchart's start and stop points and helps to convey a clear sense of the process's flow.
Input/Output Symbol: It is frequently pictured as a box with a parallelogram shape.
The data or information that is received or entered into the process is represented by the input symbol. The output symbol is a representation of the data or information that the process generates or displays. The input/output sign denotes communication with end users, outdoor equipment, or data sources.

It assists in clearly and consistently visualizing the data flow into and out of the process.
Processing Symbol: It is frequently shown as a box with a rectangular shape. The processing symbol represents a task, calculation, function, or operation performed during the process. It stands for the primary process activity or transformation. It describes the logical procedures to process the input and provide the intended result.

The processing symbol represents the main actions or tasks during the process flow.
Decision Symbol: It is frequently depicted by a box with a diamond shape. When two or more possible outcomes exist for a logical condition, the decision symbol branches the process's flow accordingly. The condition under consideration is often depicted inside or next to the division sign. The flowchart arrows exiting the division sign show the numerous possible paths depending on the condition.
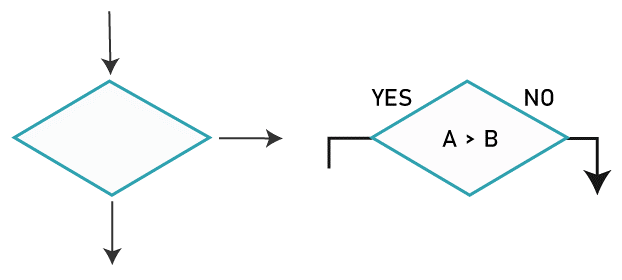
The decision symbol demonstrates how multiple paths are taken depending on particular conditions or criteria and aids in illuminating decision-making points within the process flow.
Connector Symbol: A little circle or rectangle that includes a letter or number to denote the link is frequently used to represent it. Connectors improve the organization and presentation of complex flowcharts by joining relevant parts. Even when the Flowchart spans numerous pages, they assist in maintaining a clear flow and sequencing of the process.

Connectors ensure that readers following the process flow may easily navigate and understand the Flowchart.
Flow Line Symbol: Flow lines connect various symbols or items in the Flowchart to show the sequence or order of processes. They depict the direction the control or information moves in as it passes from one sign to another.
Flow lines aid readers in comprehending the process' logical progression and flow in the Flowchart.
Hexagon (flat) Symbol: A specific action or process within a flowchart is typically represented by the hexagon symbol.

It designates a specific action or job during the broader process flow.
On-Page Reference: A letter or number enclosed in a small circle or rectangle serves as its visual representation. By reducing clutter and complexity on a single flowchart page, on-page reference symbols retain organization and clarity.

They offer an easy way to access relevant data or actions that are situated elsewhere in the Flowchart.
Off-page reference Symbol: A connection or reference to a page or sheet outside of the current Flowchart is denoted in flowcharts by the off-page reference symbol. It is a little square or rectangle with a letter or number inside.

Off-page reference symbols facilitate the management of complex flowcharts by directing the flow to another page for extra information or stages.
They offer a way to depict portions of the Flowchart spread across different pages or sheets for better organization and readability.
Delay or Bottleneck Symbol: Usually, it is shown as a wavy or zigzag line. The bottleneck or delay symbol denotes a step or procedure that takes more time than other Flowchart sections. It aids in locating possible inefficiencies or process flow bottlenecks.

Documentation Symbol: The most common representation is a rectangle with a wavy or folded top edge. The document symbol indicates the production, modification, or retrieval of a document or file within the process.

It is a stage in the Flowchart when data is recorded, documented, or referred to.
Internal storage Symbol: Usually, it is shown as a rectangle with rounded corners. The internal storage symbol denotes the process's or system's temporary or permanent data storage. It identifies the locations from where data is stored or retrieved when the process flow is being carried out.

Examples of Flowchart:
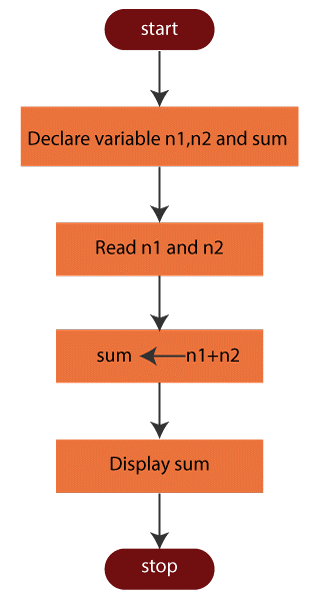
- Create a flowchart to add two user-inputted numbers.
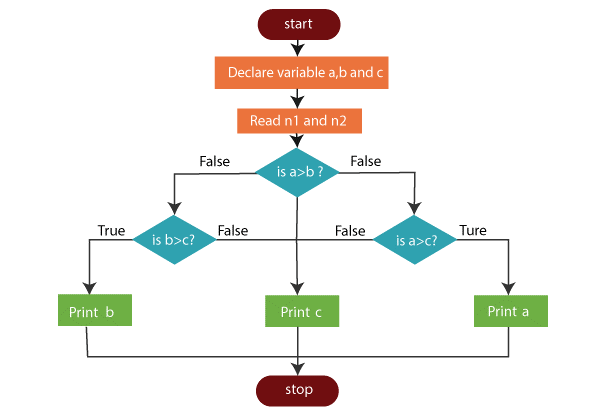
2. Create a flowchart to determine which of the user's three entered integers is the largest.
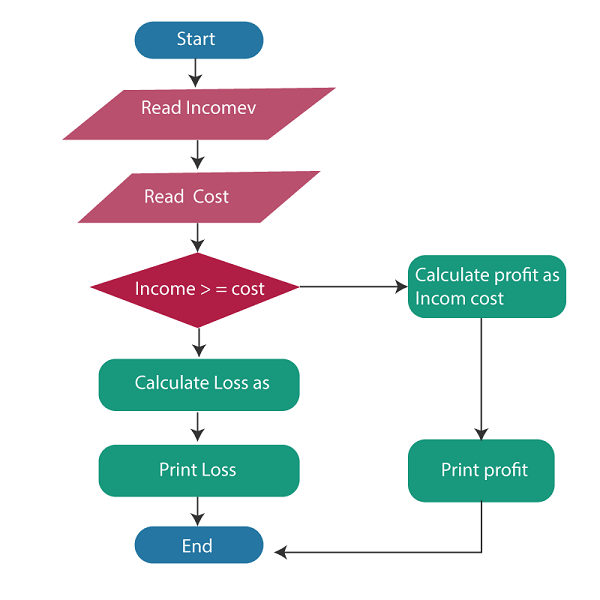
3. Create a flowchart that will calculate the profit and loss based on the value the user enters.
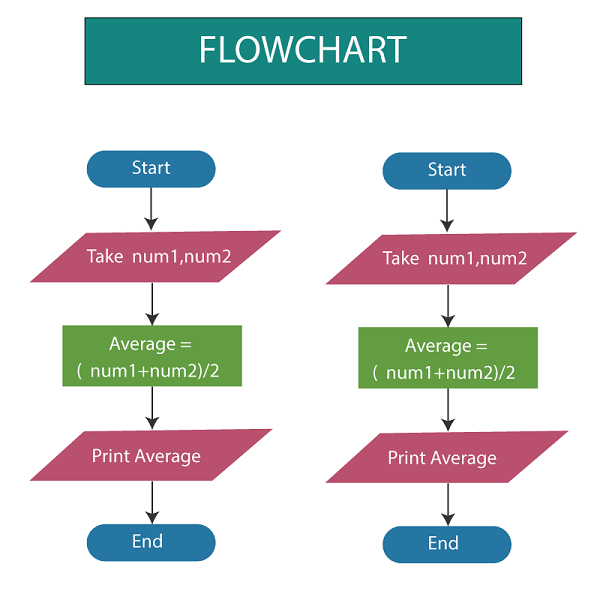
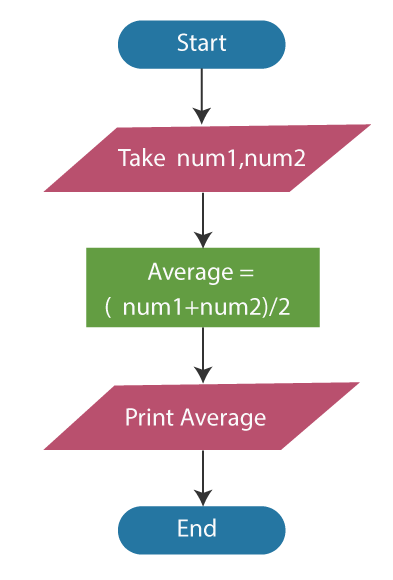
4. To calculate the average of two numbers, create a flowchart.
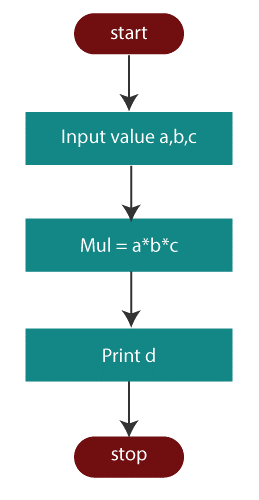
5. Create a flowchart to multiply the three digits the user has entered.
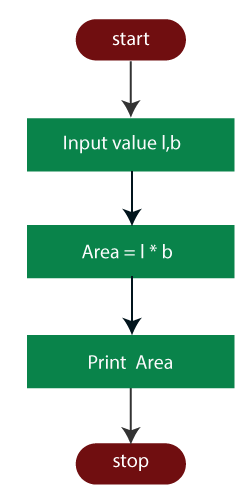
6.Create a flowchart to calculate a rectangle's area.
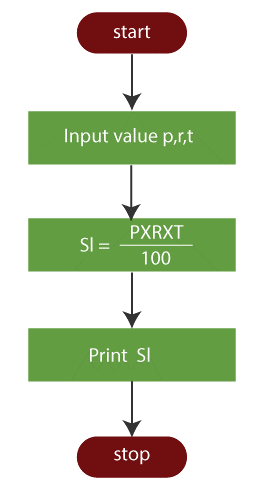
7.Create a flowchart that will calculate the Simple Interest based on the value the user enters.
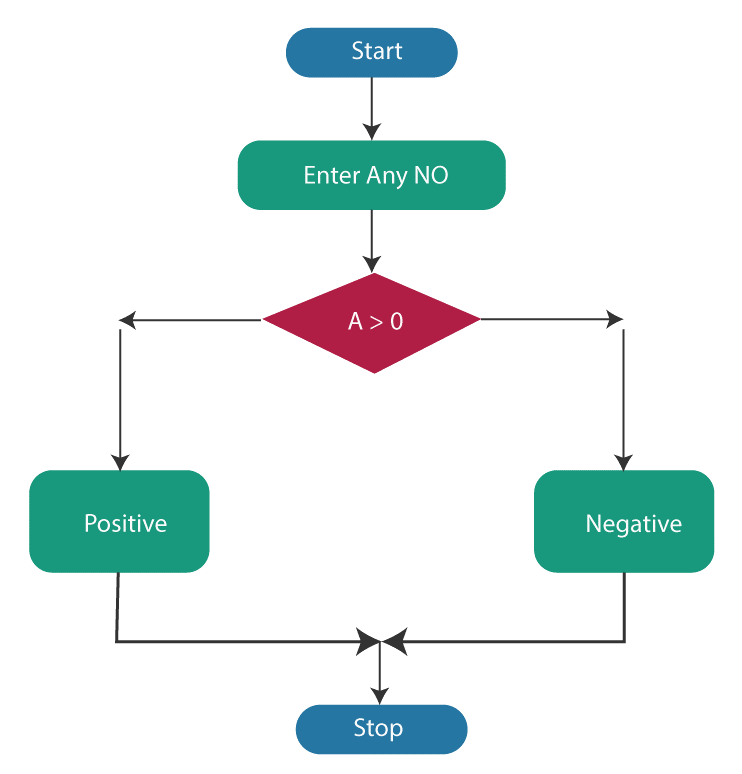
8.Create a flowchart to determine the number's positivity or negativity based on the user's entry.
A few different criteria and rules for creating flowcharts include:
- Use standard flowchart symbols: To maintain clarity and consistency, stick to standard flowchart symbols. Readers accustomed to conventional notation may need clarification if non-standard symbols are used.
- Use names that are meaningful and clear: Give the Flowchart's variables, processes, and other components names that are meaningful and clear. Understanding the function and purpose of each component is much easier by doing this.
- Use connection symbols for complicated flowcharts: If the Flowchart is lengthy or intricate, consider using connector symbols to link its many pages or sections. This aids in keeping a clean, orderly image.
- Include start and stop points: A flowchart should clearly show the start of the process (typically represented by an oval). The procedure should also have an endpoint typically indicated by a rounded rectangle or oval.
- Use consistent spacing and alignment: To improve reading and visual clarity, keep connections and symbols at a consistent distance from one another. This makes it easier to grasp and helps to separate the various portions of the Flowchart.
- Keep the flow and sequencing correct: Ensure that the Flowchart follows a logical progression of decisions, activities, and steps. Symbols should flow into one another without any gaps or overlapping lines.
- Identify decision points and conditions: Decision points where a decision is made depending on a condition are indicated by decision symbols, typically represented by diamonds. Use arrows to indicate the control flow depending on the decision and mark the condition or question.
Advantages and Disadvantages flowchart in c
Benefits of flowcharts in C:
- Understanding and analyzing program logic is made more accessible by visual depiction.
- Increases developer cooperation and communication.
- It aids in identifying faults or inefficiencies and aids in visualizing the program flow.
- Helps in planning and designing programs.
- Helpful for diagnosing and resolving code issues.
Drawbacks for flowcharts in C
- It can get complicated for complicated and huge programs.
- Lack of syntax and programming specifics.
- Inability to capture dynamic behaviour and limited interactivity.
- Problems with maintenance arise when programs are modified.
- Requires proficiency with flowchart conventions and knowledge of their symbols.