How to generate random numbers in Excel
In this tutorial, we will discuss the following things in detail that are as follows:
- Introduction about Random Numbers used in Microsoft Excel.
- Discuss how to generate the Random Numbers in Microsoft Excel.
Introduction about Random Numbers
It was assumed that this function is activated by the help of the enabling of respective add-ins, which we are going to make it discuss in detail in this tutorial respectively.
But before deep-diving into this concept in detail, firstly, we will look at a few examples related to this particular function. This feature will effectively provide seven distribution types to generate the numbers based on specified parameters. And for this, we will open an excel file and then click on any particular cell from the Microsoft Excel Sheet for the starters. Then, we must take that the input that is input =RAND ().
Moreover, Microsoft Excel is a very versatile and powerful spreadsheet tool for doing various analytics tasks efficiently.
And from that, one of them is none other than the statistical function, which is used for the mathematical point of view in Microsoft Excel. The related example with the above procedure, the Statistical Function, is the efficient ability to generate the numbers randomly in the particular workbooks of Microsoft Excel.
This will effectively help generate the random number, as seen in the attached screenshot below.
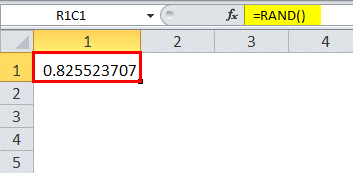
Furthermore, this could be considered the most important, simple, and essential form of the RAND function that requires no particular type of argument that needs to be written within the parentheses.
Discuss how to generate the Random Numbers in Microsoft Excel.
It was known that the random number generation in Microsoft Excel is straightforward to use by any individual (Beginner to Microsoft Excel). Now we will effectively see how to generate a random number in the Microsoft excel sheet with the help of the various examples discussed below.
We will be having a serious look at more advanced forms of the examples in the following few paragraphs respectively.
Examples # 1: How to generate a list of Random Numbers in the Microsoft Excel
To generate a list of random numbers in Microsoft Excel:
- To develop the random numbers in Microsoft Excel, we can make use of the function that is the Random Function.
- It could be achieved with the help of filling the very first cell with =RAND () and dragging out the fill handle until we encounter the respective cell we want, as shown in the attached figure below.
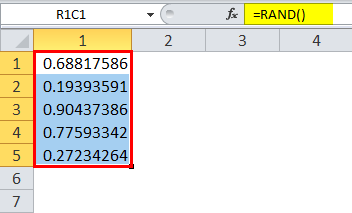
- We can copy and paste the values to the various columns to make the RAND function go away and use the values effectively, as in this case with any excel formula.
Example #2: To generate a list of random numbers between the specified values:
We can make use of the Rand function to create a list of numbers between two specified values by using two different modifications of this function, as shown below respectively:
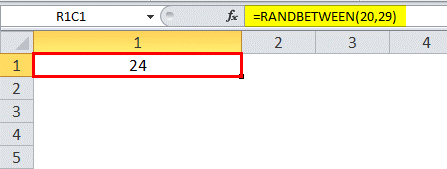
- We will make use of the function, which is the RANDBETWEEN function, to generate the random numbers between the two whole numbers between the two integers. As clearly depicted in the below-attached figure as well.
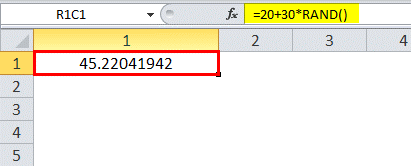
- And the RANDBETWEEN Function generates the fractional number between the two integers or the particular fractions, as seen in the below-attached figure.
Example #3: To generate a random set of values from a given list:
And to generate the RAND Function, we can effectively develop the particular location of the values from the given list of strings. In these cases, we will pick out the random numbers from the detailed list, as shown in the below-attached screenshot.
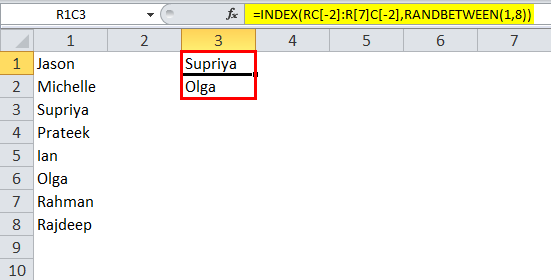
And to simplify this, we can effectively change the reference style to the respective default in the Excel Menu and then the INDEX Function is combined with the RANDBETWEEN for such cases.
What are RAND and RANDBETWEEN, and where are they used?
The Microsoft Excel RAND Function can be used efficiently to generate the actual random number in the uniform distribution of less than one and greater than or equal to 0 until and unless we specify the range.
Moreover, the RANDBETWEEN FUNCTION effectively returns the random integer number between the two specified values.
Both the above-discussed functions return the random numbers with the help of the single distribution. The respective numbers may or may not be in the requested range's lower or upper limits. Furthermore, the uses of these functions range from marketing analytics to quality control and forecasting.
And it was noted that we had seen the various examples of the function, that is, the RAND and the RANDBETWEEN, for the random number generation; now, we will look at the process of activating the multiple features enabling these functions in Microsoft Excel.
How to Activate and make use of it?
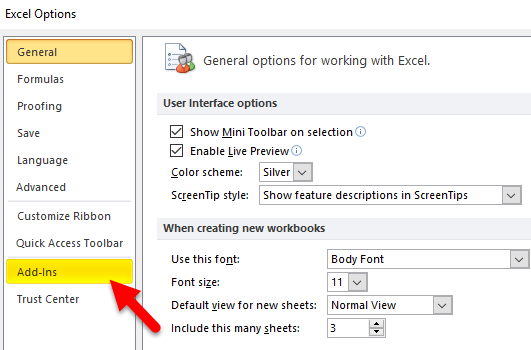
We can quickly start by opening up the respective Microsoft Excel and then clicking it on the menu that is the "File Menu." Then we can begin effectively by clicking on the "Options", which takes the screenshot as depicted in the attached screenshot below.

And after clicking it on the "Options", it will effectively select the ADD-INS menu in the respective pop-up window that gets to appear, as depicted in the attached screenshot.
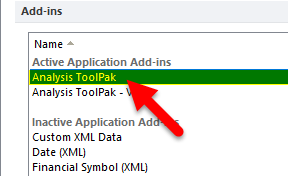
And then, we will select the "Analysis Toolpak" depicted in the below-attached screenshot.
Then we will select the Analysis Toolpak and click on the "GO" in the respective "Manage Tab", as seen in the screenshot below.
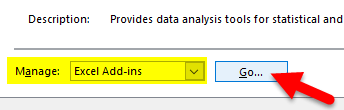
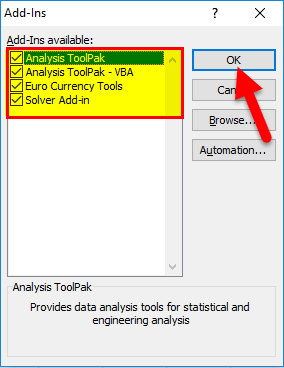
Performing the above step will open the other pop-up window. In this screen, we will select only the "Analysis Toolpak" or effectively select all and then click on the "OK" button.
As depicted in the below-attached screenshot respectively.
Once an individual has activated the functionality, we can use it in two different ways. One of them is shown below with the help of the example that can be used to use the functions and formula effectively. The other most user-friendly graphical is to make use of the Data Tab as described below with the help of the respective example:
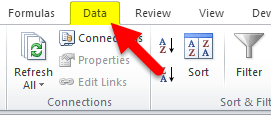
Step 1: First, we will click on the "Data", which is effectively present on the "Excel Toolbar", as seen in the attached screenshot below.
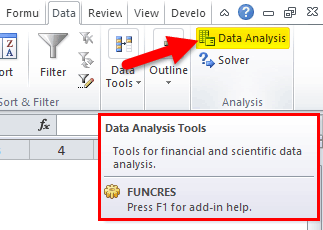
Step 2: Now, we will click on the "Data Analysis" present far left on the respective toolbar, as clearly seen in the below-attached screenshot.
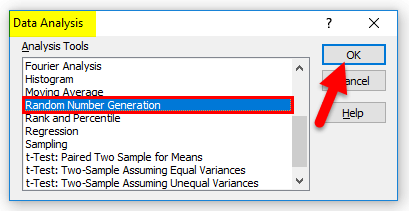
Step 3: Performing the above step will open the pop-up window, and from that, we will select "Random Number Generation", and then we will click on the "OK" button, as seen in the below-attached screenshot respectively.
Step 4: After performing the above respective steps, it will open up another pop-up, as seen in the screenshot below.
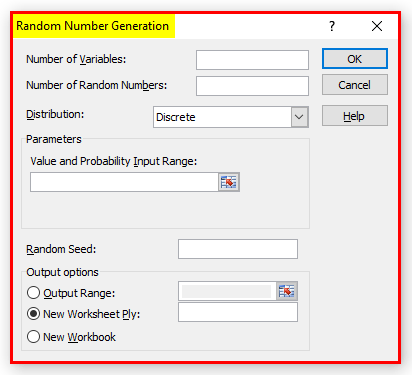
It is noted that there are seven types of distribution which are made available in the respective Microsoft Excel to generate the random number: Bernoulli, Binomial, and Patterned, as well as the discrete distribution types.
Moreover, any distribution can be chosen depending on the various types of data that we have. For this exercise, we will be effectively using the Uniform distribution, and the following parameters should be specified while using this particular functionality.
- The Number of the variables would easily decide the total number of columns used to display the result.
- The number of the respective random numbers we wish to generate.
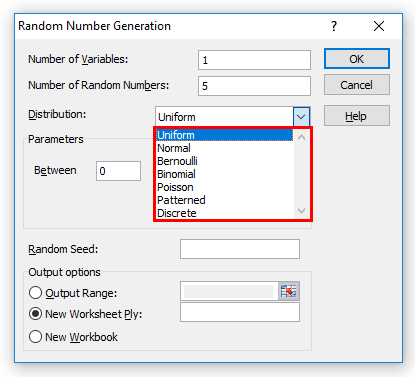
- And the distribution type wishes for the particular numbers, which would appear as the drop-down menu as seen in the below-attached screenshot.
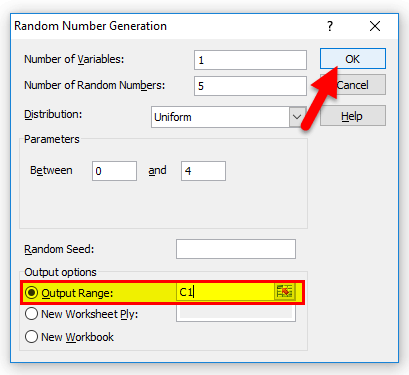
- And for the Uniform distribution, we will specify the upper as well as the lower limit, as clearly seen in the below-attached screenshot.
We will use the Random Seeds, which keeps the data centred on the values entered, which is quite helpful in generating the same set of numbers for later use.
- The particular output range must be specified so that excel would effectively know where to put the result and then click on the "Ok" button, as depicted in the below-attached screenshot.
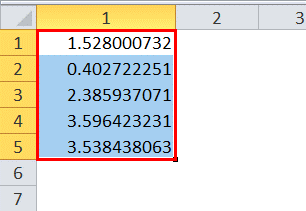
- And the final output will look like this:
As it was concluded that the usefulness of the random numbers generations in the Microsoft Excel depends a lot on the familiarity with the respective statistics as well as the distribution, there are the various following short description of each distributions qualities.
- Uniform: It is defined to be the any number specified between the high and the low values effectively.
- Normal: Mean as well as the standard deviation within the specified range.
- Bernoulli: It could be defined as the probability of the success on the given particular trail that is either 0 or it could be 1.
- Binomial: It could be defined as the probability of the success for the given number of the trails effectively.