Histogram in Excel
What is Histogram in Excel?
“ A histogram is a graphical tool familiar for summarizing discrete or continuous data, where the data are measured on an interval scale.”
Karl Pearson described this technique to assess the probability distribution of the given variable. It displays the data in a frequency of interval for the metric variable. The intervals are known as "bins" that have similar widths. It is used for data analysis in business, where the data are represented in specified ranges in the column chart. The Histogram has the feature of simplicity and versatility. It represents the data in continuous frequency distributions, and the data are described in the form of a bar chart. There is no gap present between the bar chart. The data points in the Histogram are grouped to represent the logical range or bit.
Additional Features in Histogram
To enhance the appearance, additional features like colour and distance are changed. Let's have a look at how to format the Histogram in Excel.
- X-axis – The dataset variables are represented in charts X-axis.
Split by A chart table is created for categorical variables where each cell is designed with a separate category by Split by Variable. This feature adds dimensions to the chart by showcasing the information in a particular variable category.
- KDE curve- If this feature is enabled, the kernel density estimate curve will display in the chart
- Distribution Curve- If this feature is enabled, the distribution fitting curve will display in the chart.
Types of Histogram
The various types of Histogram as follows,
- Normal Distribution
- Bimodal Distribution
- A Right Skewed Distribution
- A Left Skewed Distribution
- A Random Distribution
Normal Distribution
It is one of the statistical functions. For given data or parameters it calculates the probability density function or cumulative normal distribution. It is used in Stock Market Analysis. Formula used to calculate Normal Distribution is,
=NORMDIST(x, mean, standard_dev, cumulative)
The normal distribution curve is bell-shaped with one peak and is symmetric around the mean.
Bimodal Distribution
Usually in Normal Distribution the graph contains one peak. In bimodal distribution it contains two peaks. The data present in the bimodal are separated and analyzed as a separate normal distributions. Another name for this distribution is double peaked distribution.
Step 1: Enter the data in a spreadsheet. Here the id.no and students marks mentioned.
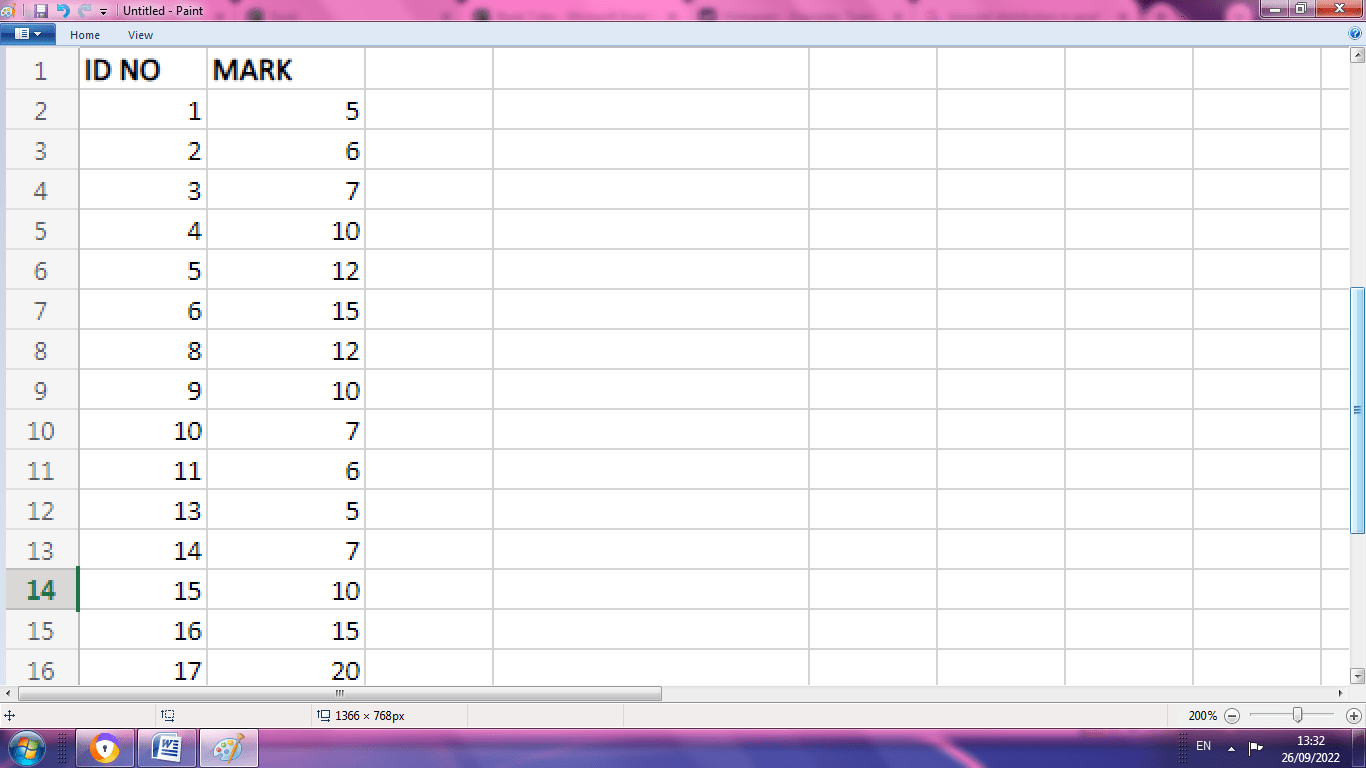
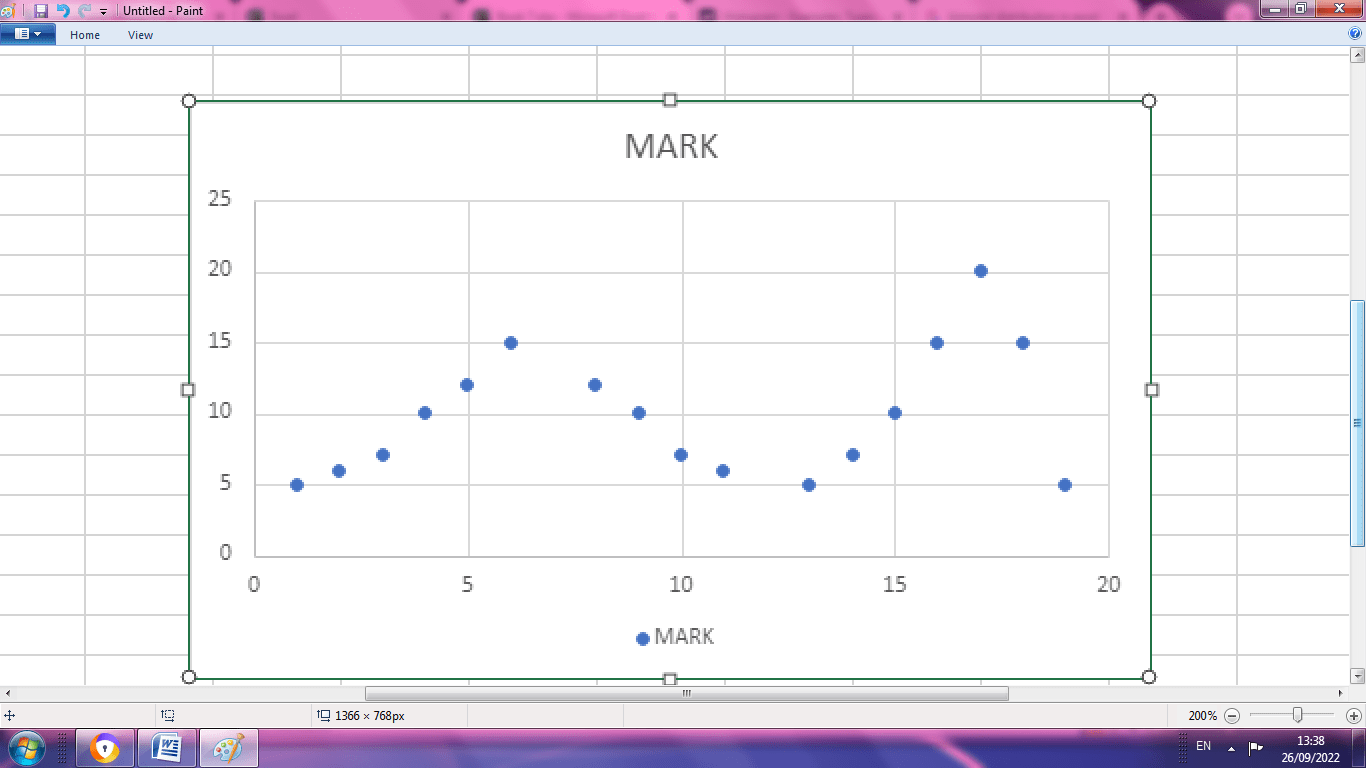
STEP 2: Select the Id.no and marks and click Insert>Chart>Scatter. A chart is created for the given data. It has two peaks based on the variation of data.
Right Skewed Distribution
In right skewed distribution large sets of data present in the left side and only a few data present in the right side. Another name for this is positively skewed distribution.
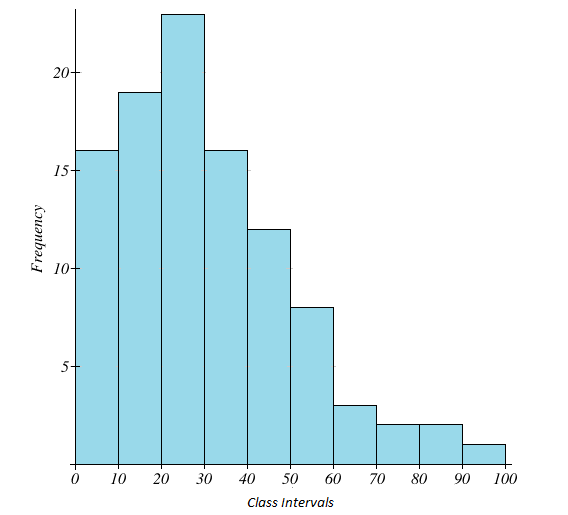
A look alike of right skewed distribution is mentioned above.
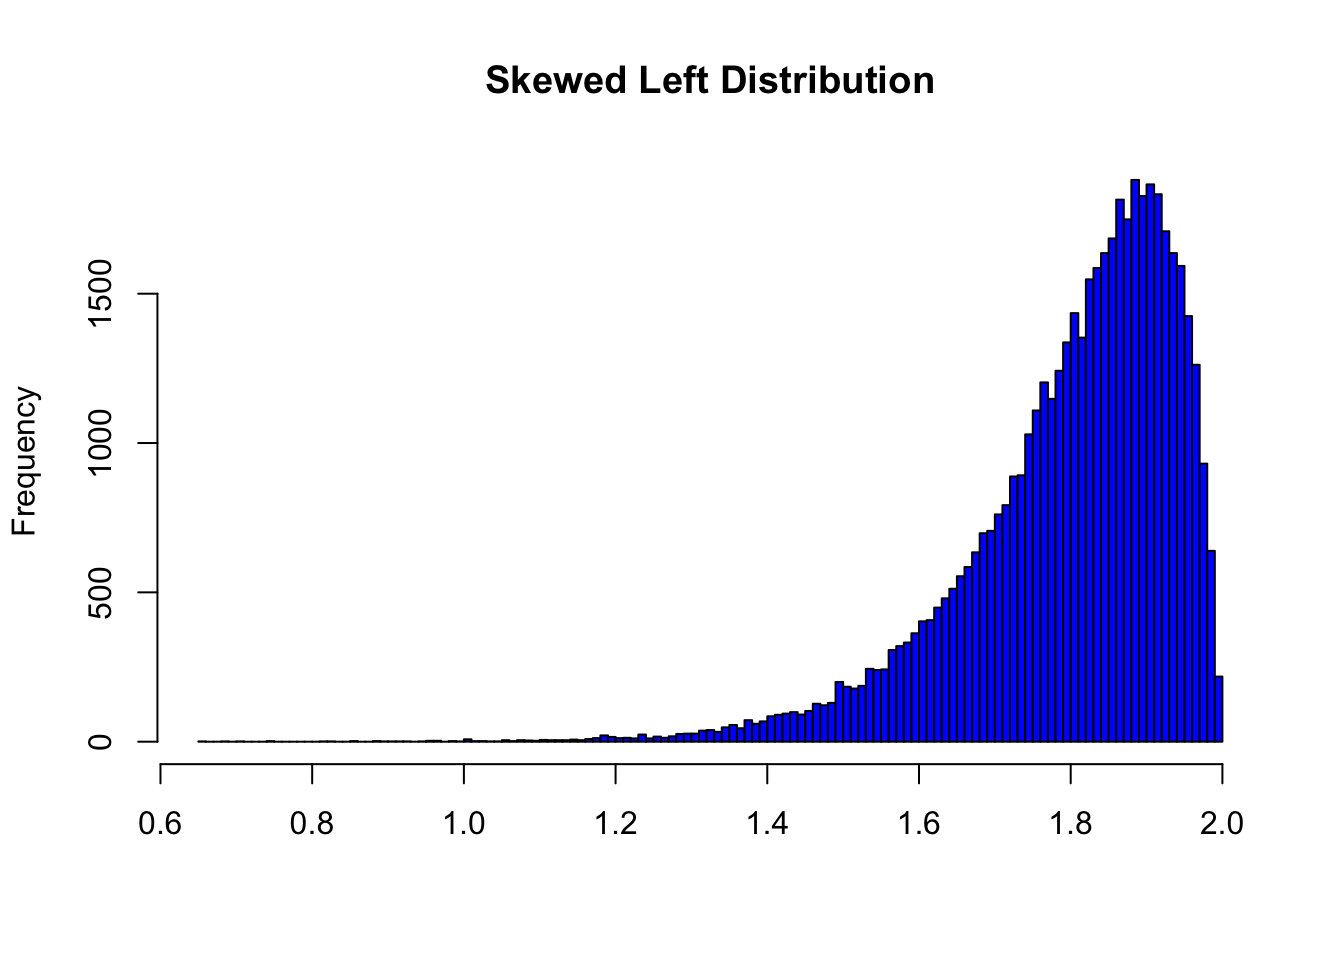
Left Skewed Distribution
Another name for Left skewed distribution is Negatively Skewed Distribution. In this distribution large number of dataset occur in the right side and only a few data occur in left side. If the range boundary of the data occurs in right side left skewed distribution takes place.
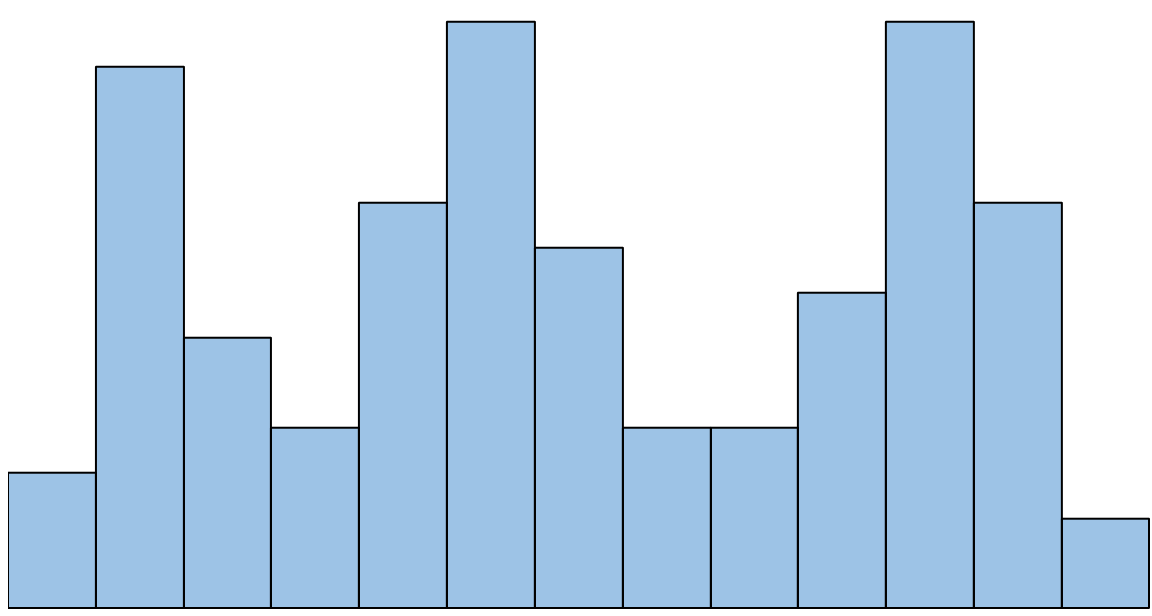
Random Distribution
As the name itself suggests, it has several peaks called as multimodal distribution. The data are separated and analyzed and it is a combination of normal distributions.
How to create a Histogram in Excel?
Creating the Histogram in the Excel Spreadsheet varies depending upon the user's Excel Version. In the histogram, data intervals are called Bins, and the number of indices is called Histogram. It is used to relate one variable.
To implement normal distribution in Excel, following steps are implemented.
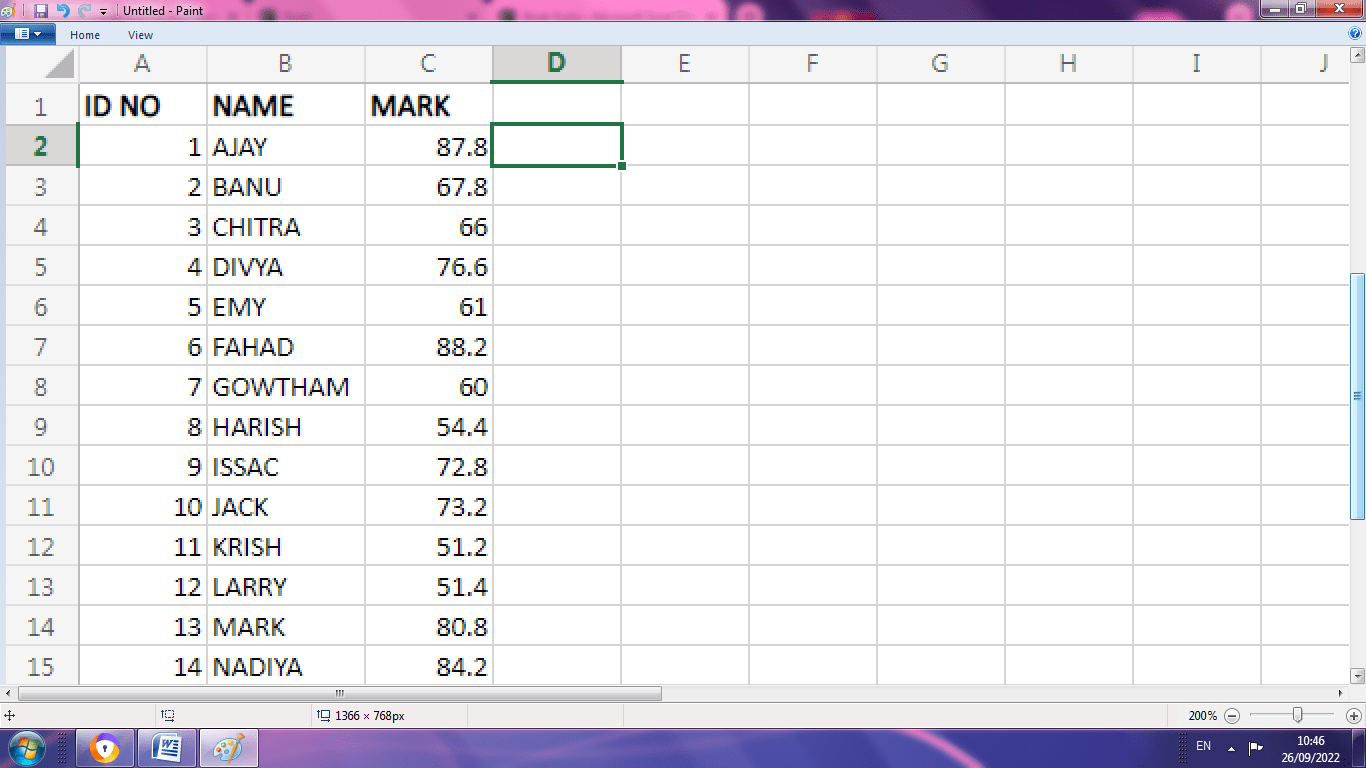
STEP 1: Enter the data in spreadsheet. Here the student Id, Name and marks are entered.
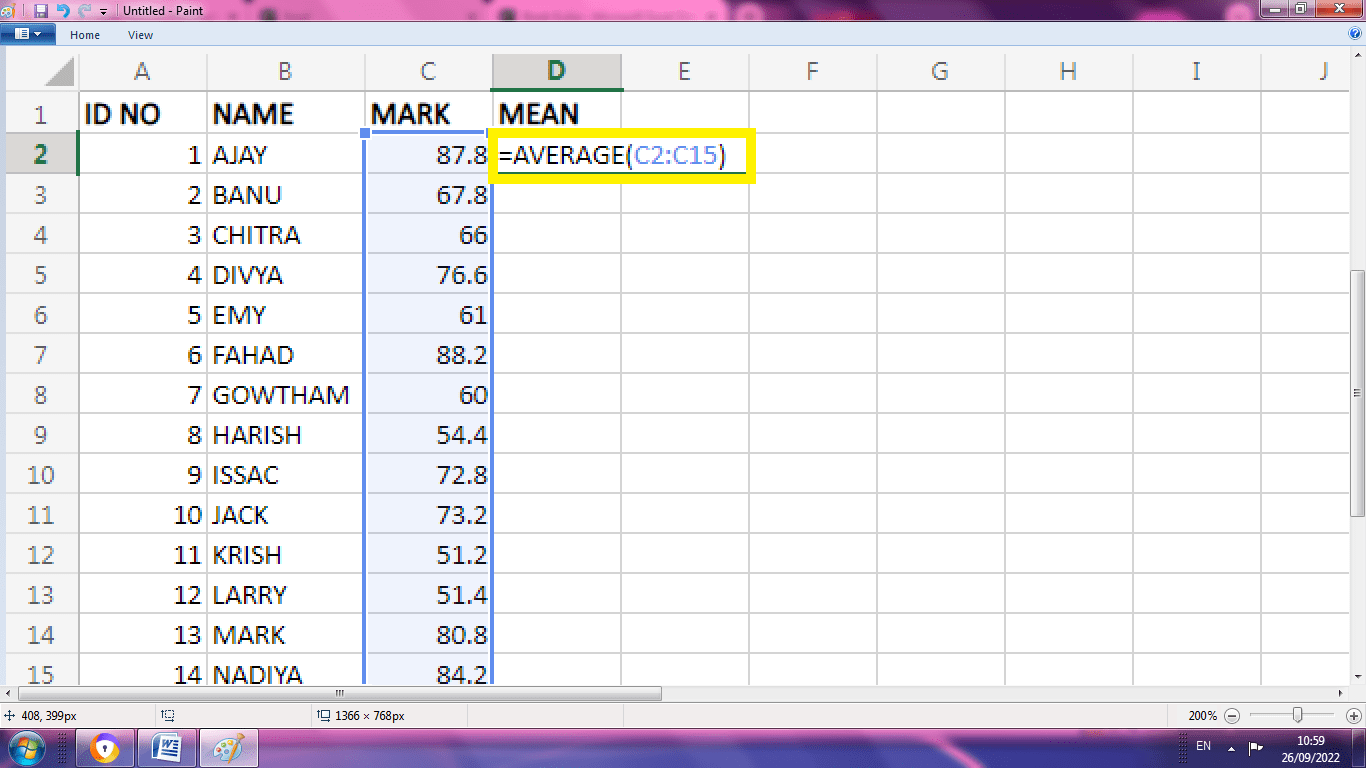
STEP 2: To calculate normal distribution, the mean and standard deviation is needed. To find the mean, the average formula is applied. Choose a cell in the worksheet and type the formula as =AVERAGE (range)
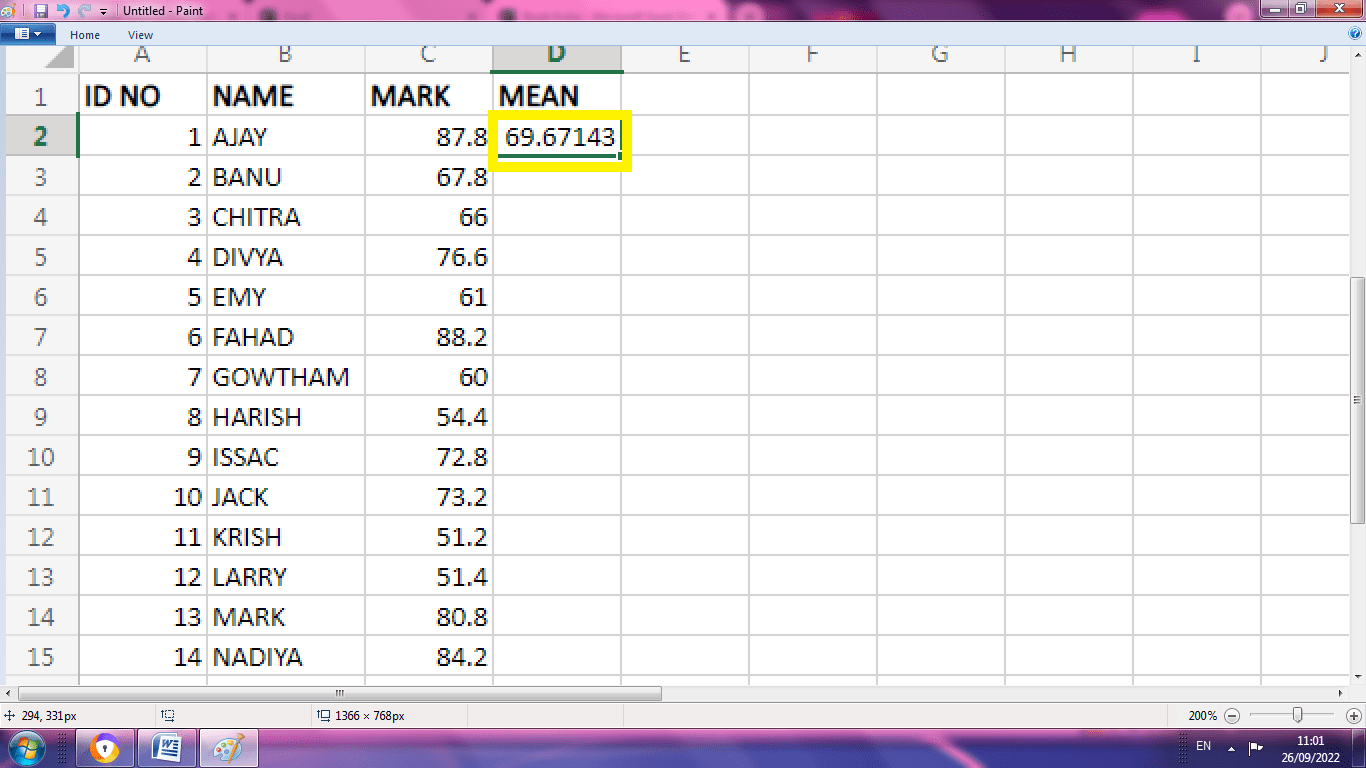
STEP 3: The mean value for C2:C15 is displayed in the cell D2.
STEP 4: To found standard deviation, the formula used are =STDEV (range)
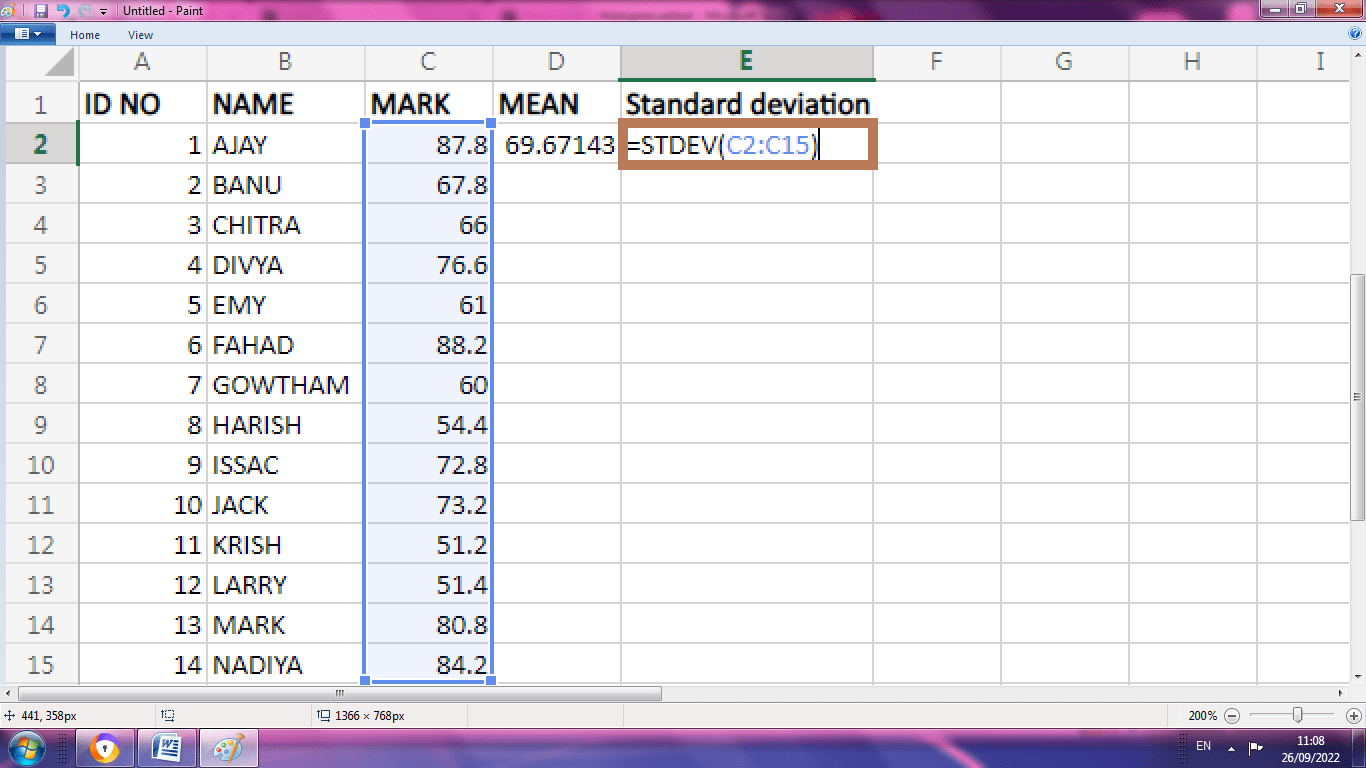
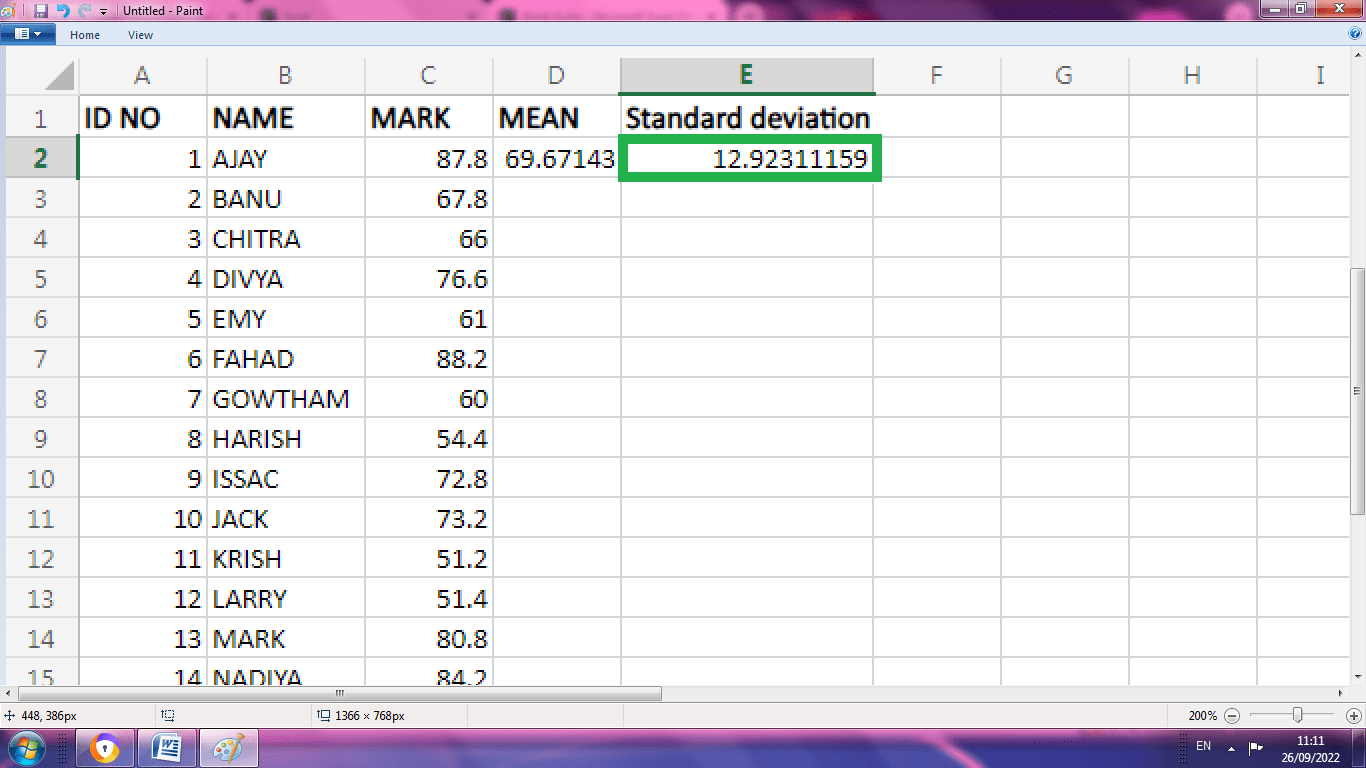
STEP 5: The standard deviation for C2:C15 is calculated and displayed in the cell E2.
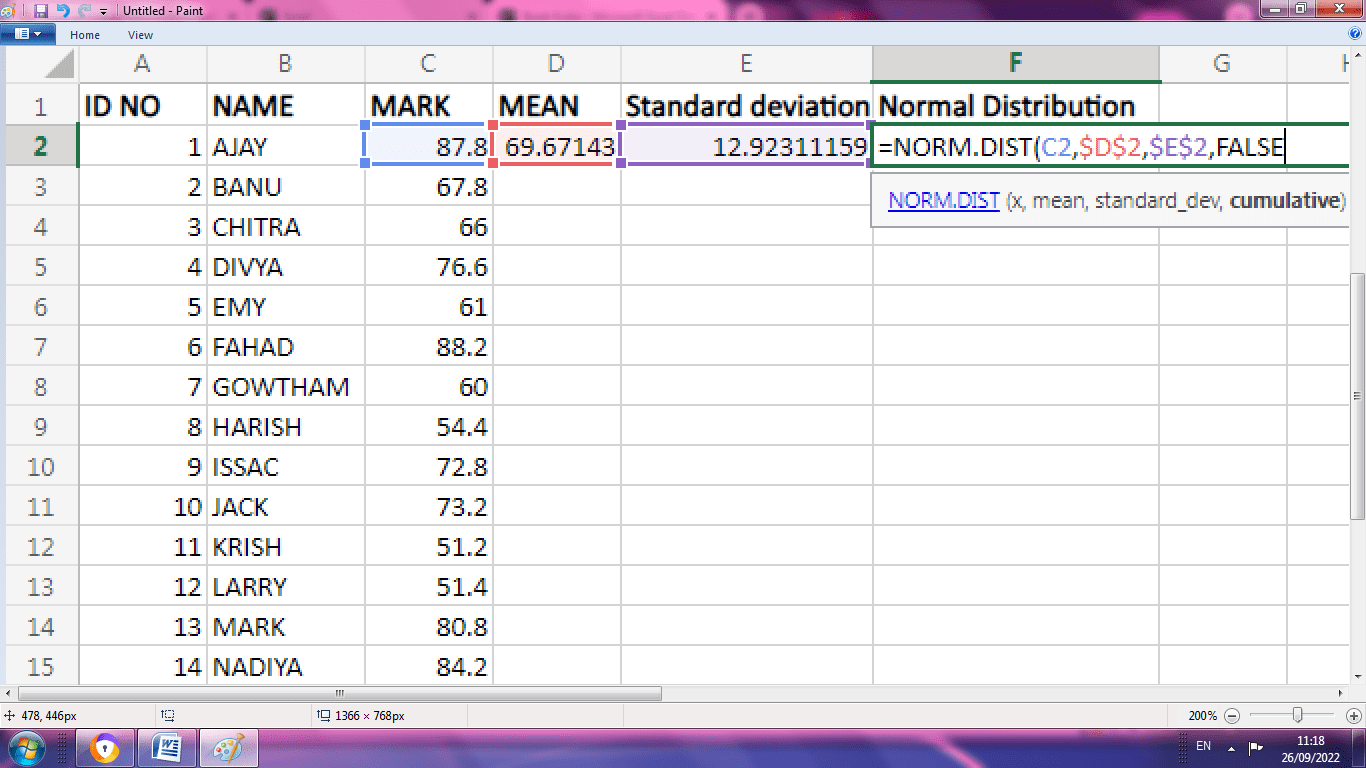
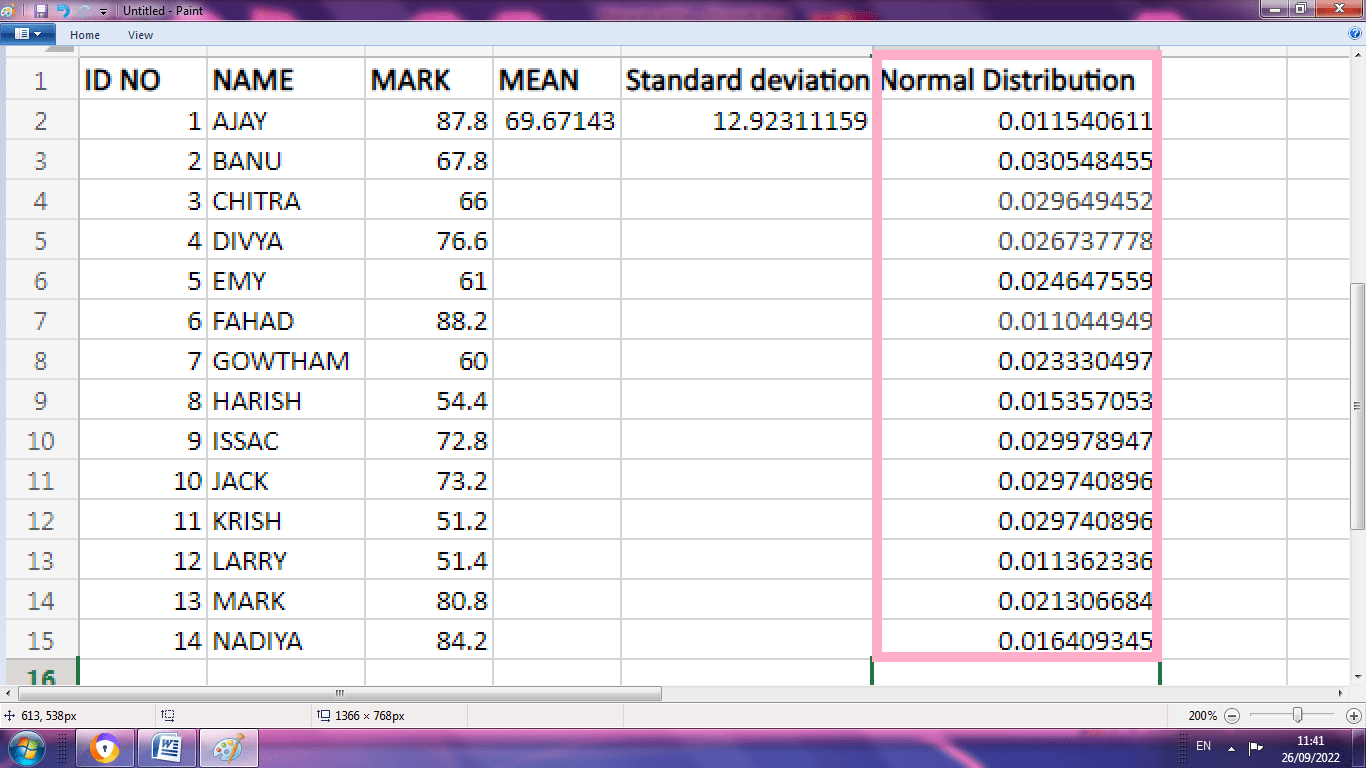
STEP 6: As mean and standard deviation is found, the normal distribution is calculated using the formula =NORM.DIST (C2, $D$2, $E$2, FALSE)
STEP 7: The value of normal distribution is shown below.
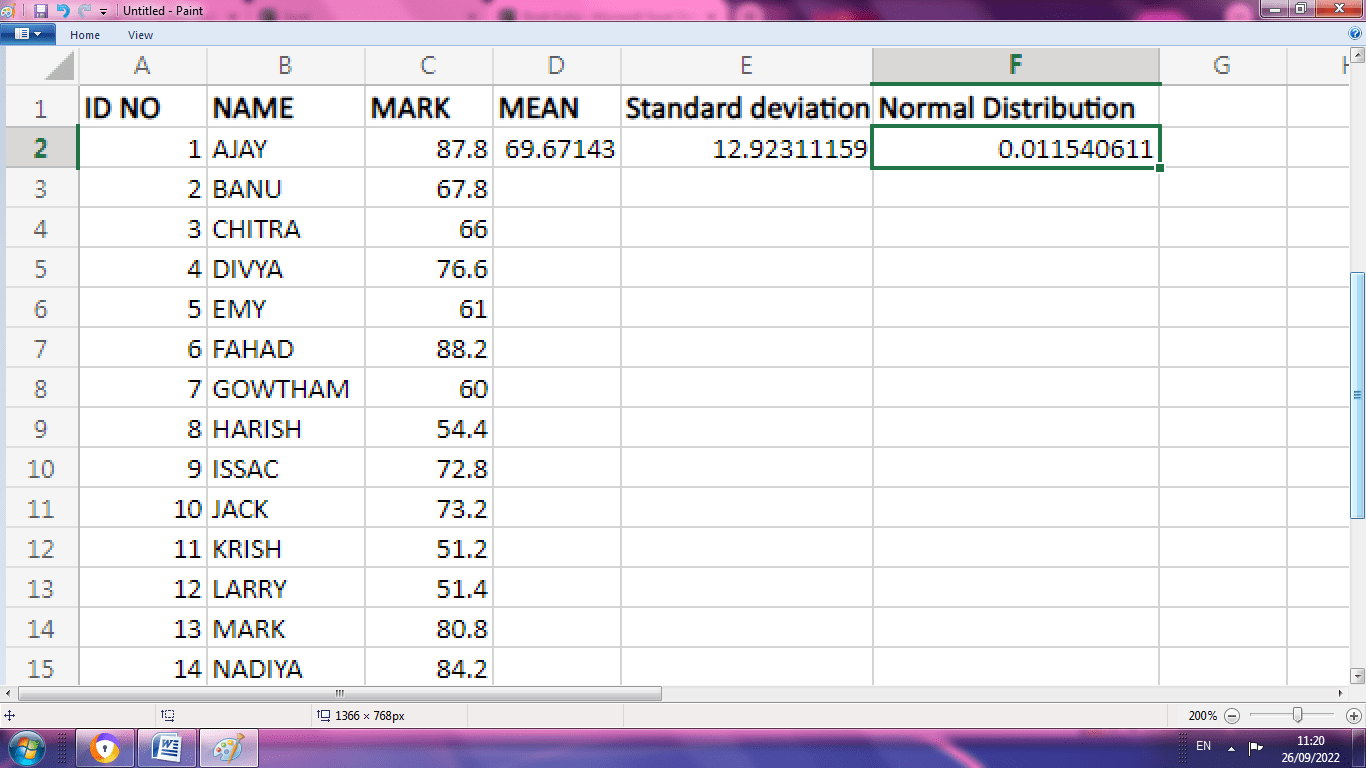
STEP 8: By applying this formula to the rest of the data, the normal distribution is calculated as shown below.
Normal Distribution Graph in Excel
To insert a graph in Excel, sort the mark columns from lowest to highest for the normal distribution of the graph.
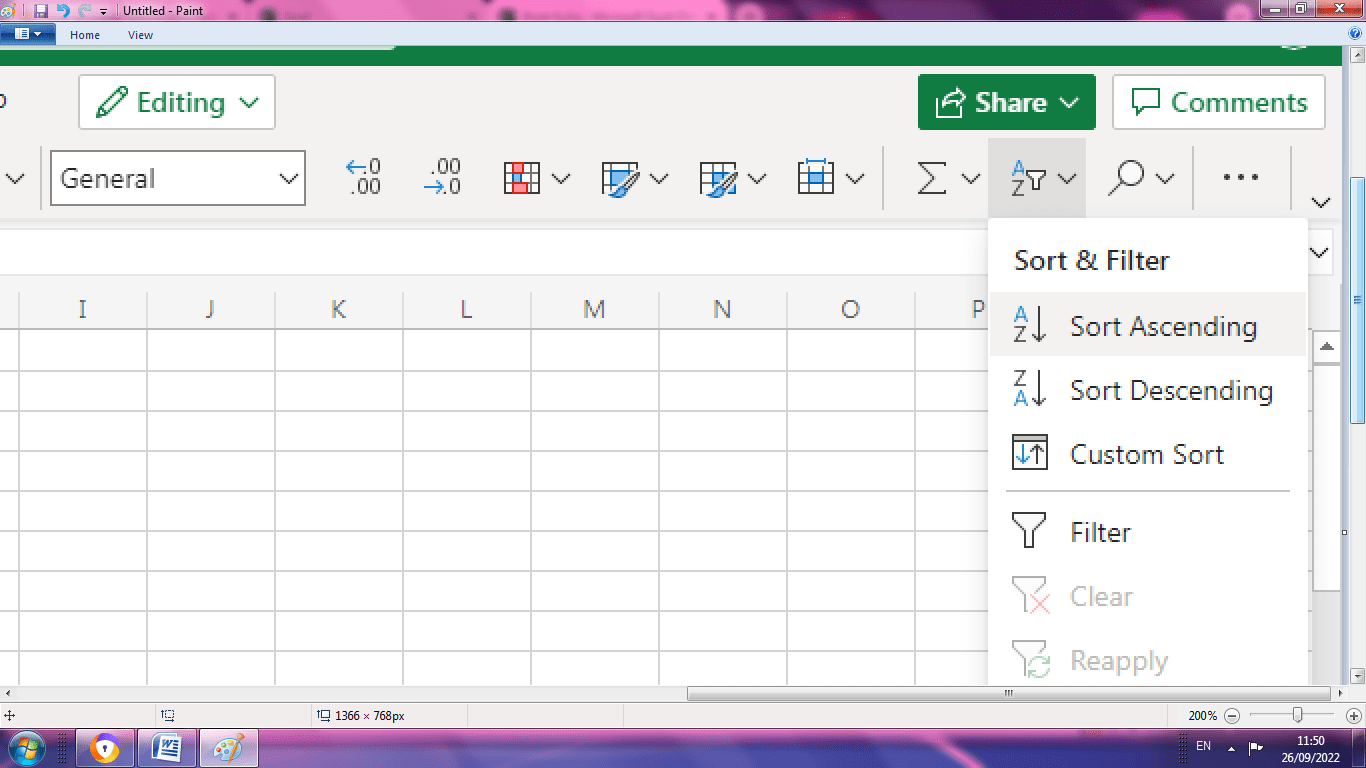
STEP 1: To sort the values from smallest to largest, select the mark column. Choose Home>Sort & Filter> Sort Ascending
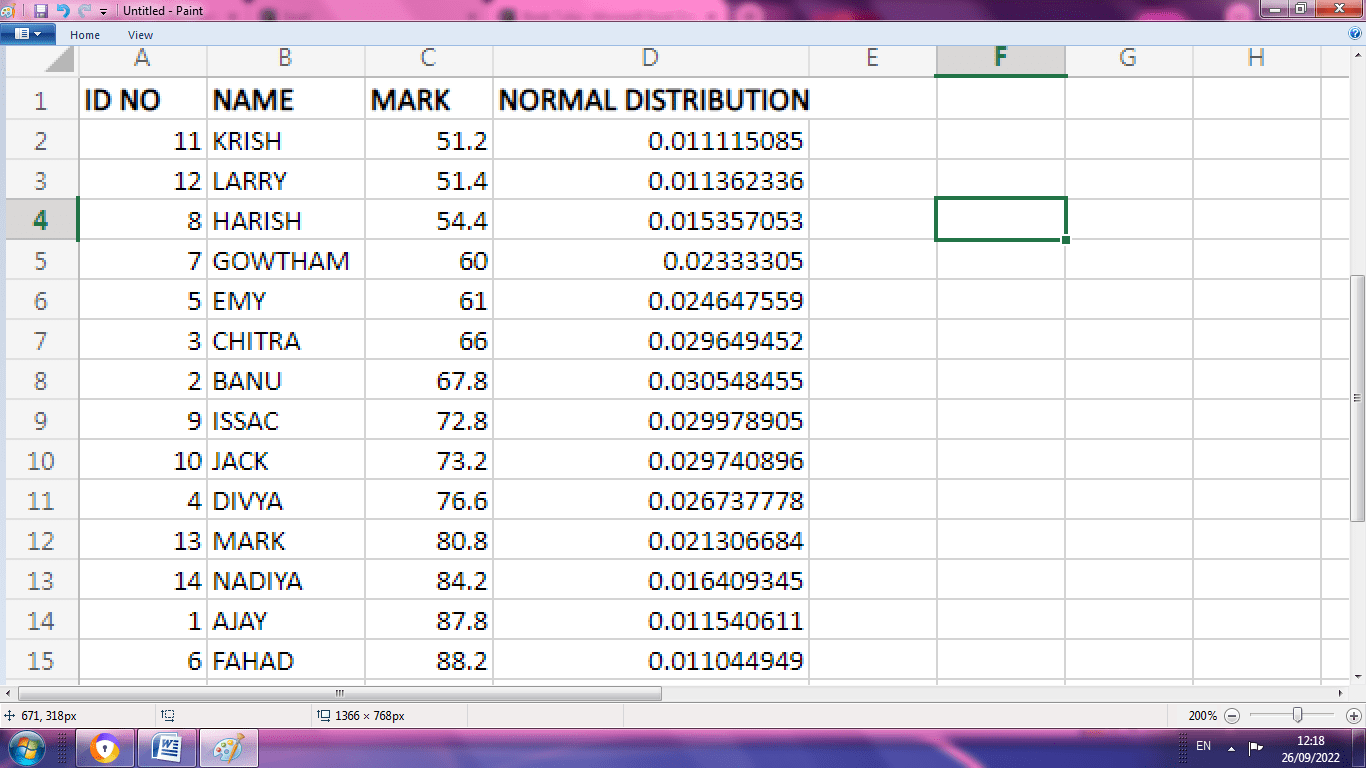
STEP 2: The values are arranged from ascending to descending order. The arranged values are shown below.
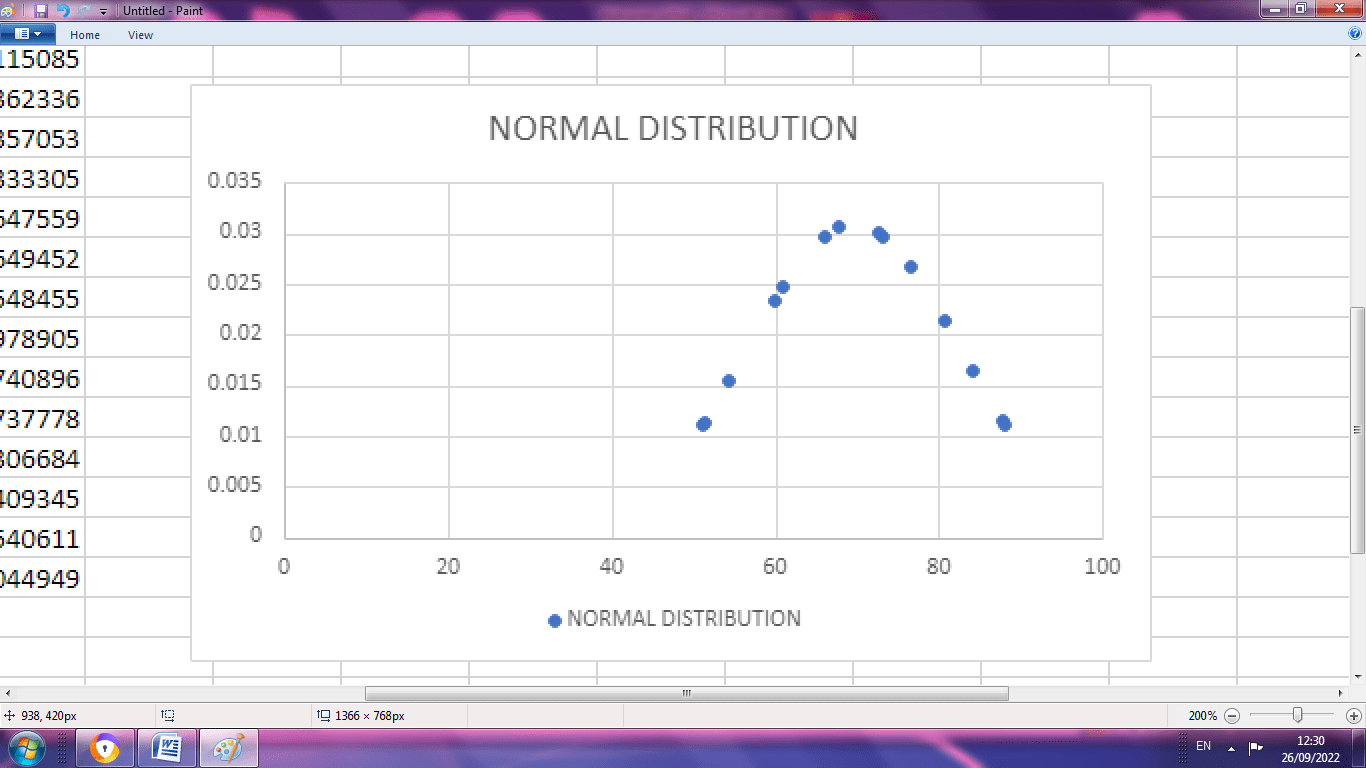
STEP 3: To insert chart select the mark and normal distribution column. Choose Insert>Insert Chart > Scatter.
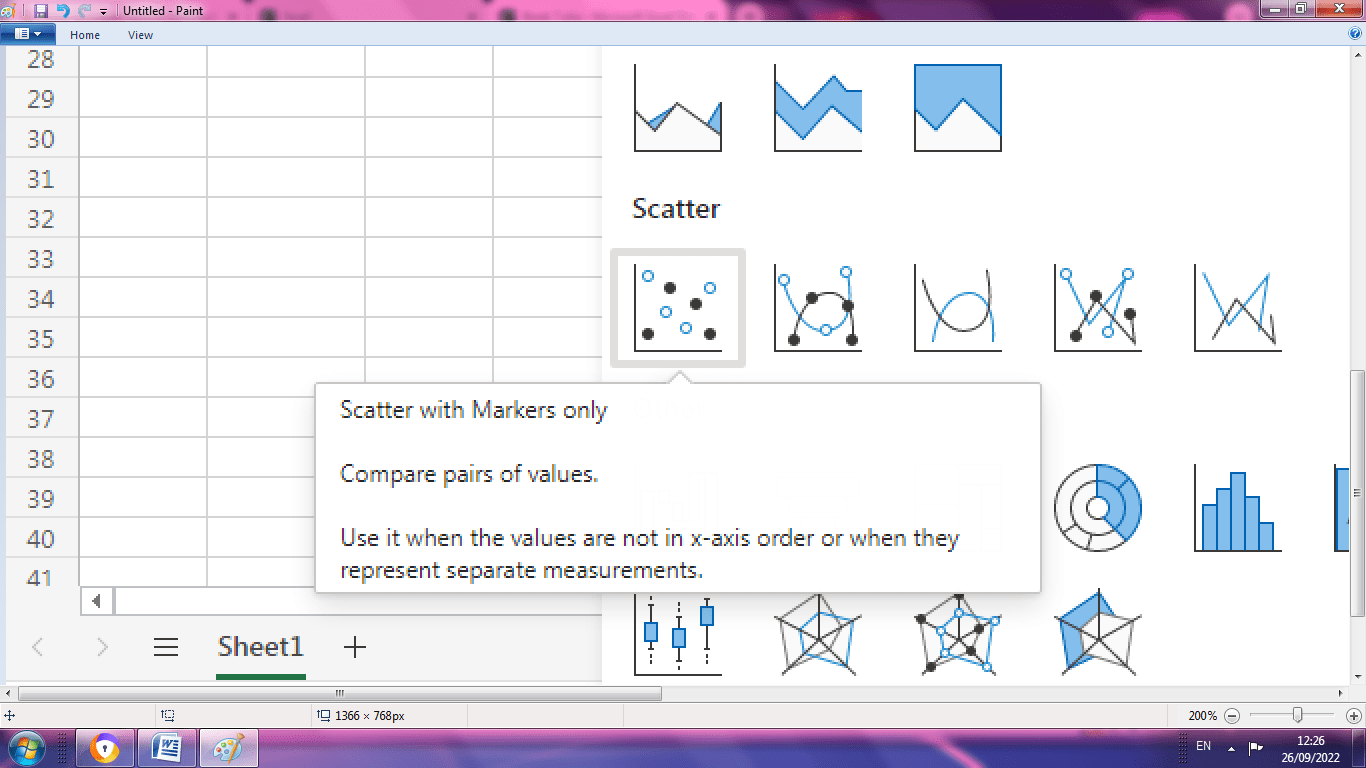
STEP 4: Select the first chart in scatter. A normal distribution graph is created for the given range of data.
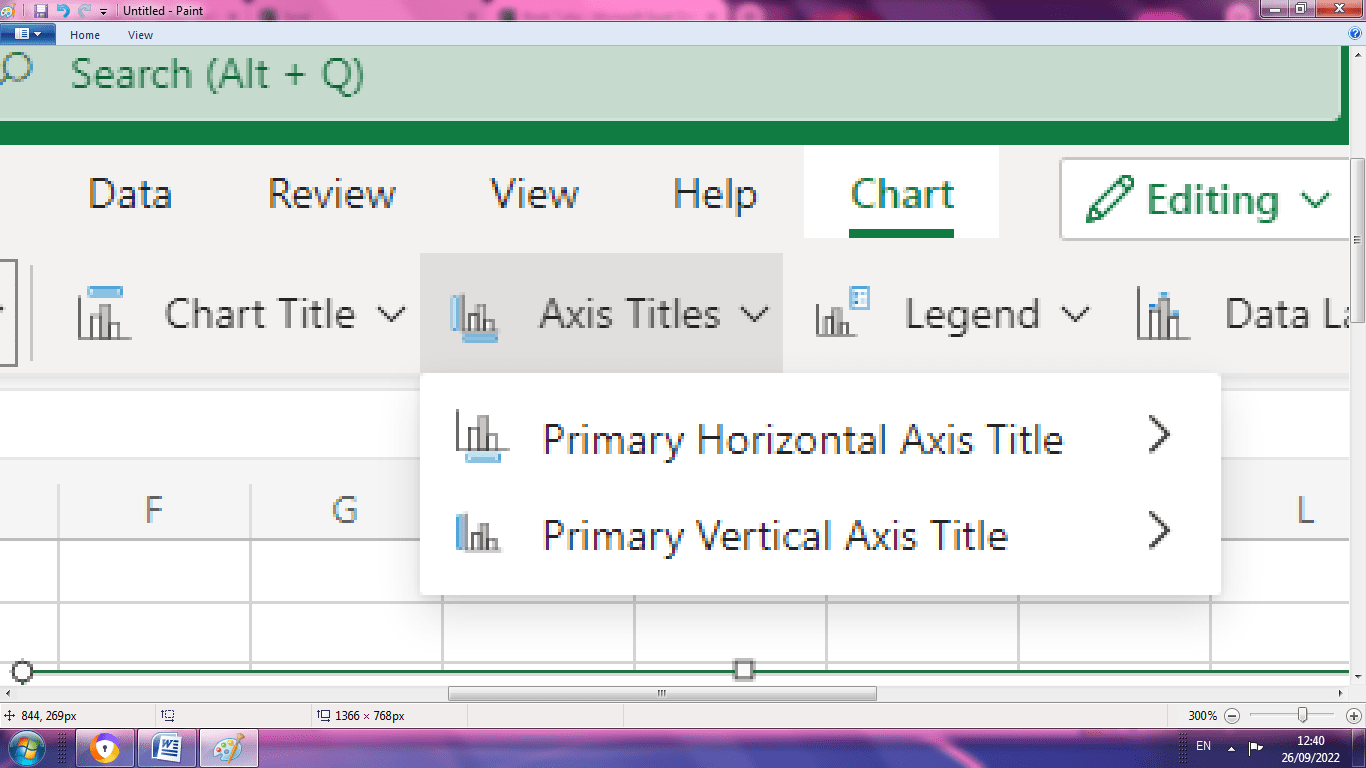
STEP 5: One can name the horizontal and vertical axes by choosing the Chart>Axis Title> Horizontal/Vertical Axis.
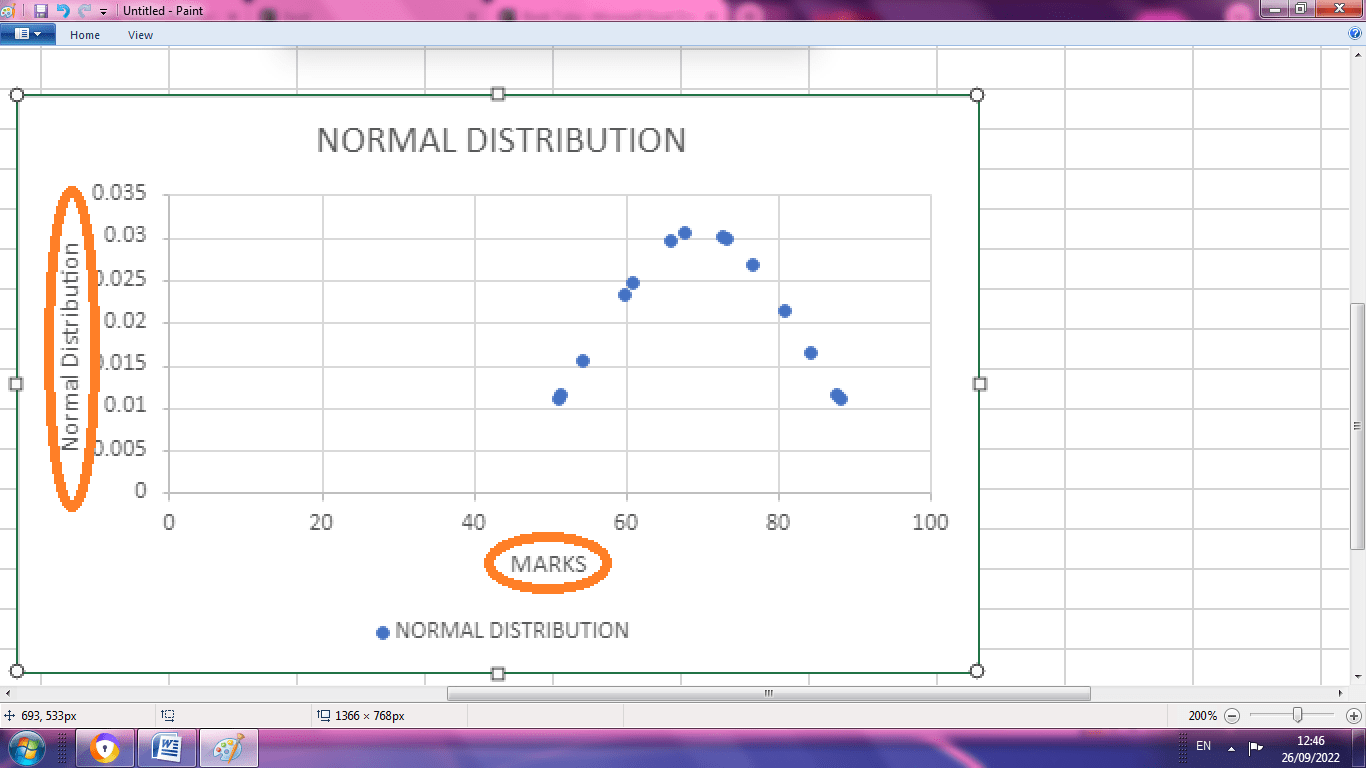
STEP 6: The horizontal and vertical axes are named as Marks and Normal Distribution.
How to create a histogram for a data in an Excel?
Excel 2016 has in-built histogram chart option.
Excel 2013, 2010 or prior version has no default histogram function. One can install it by means of Data Analysis Tool pack or using Frequency Function.
Let’s have a look about how to create a histogram chart in Excel 365.
To create a histogram for a data in excel following steps are followed.
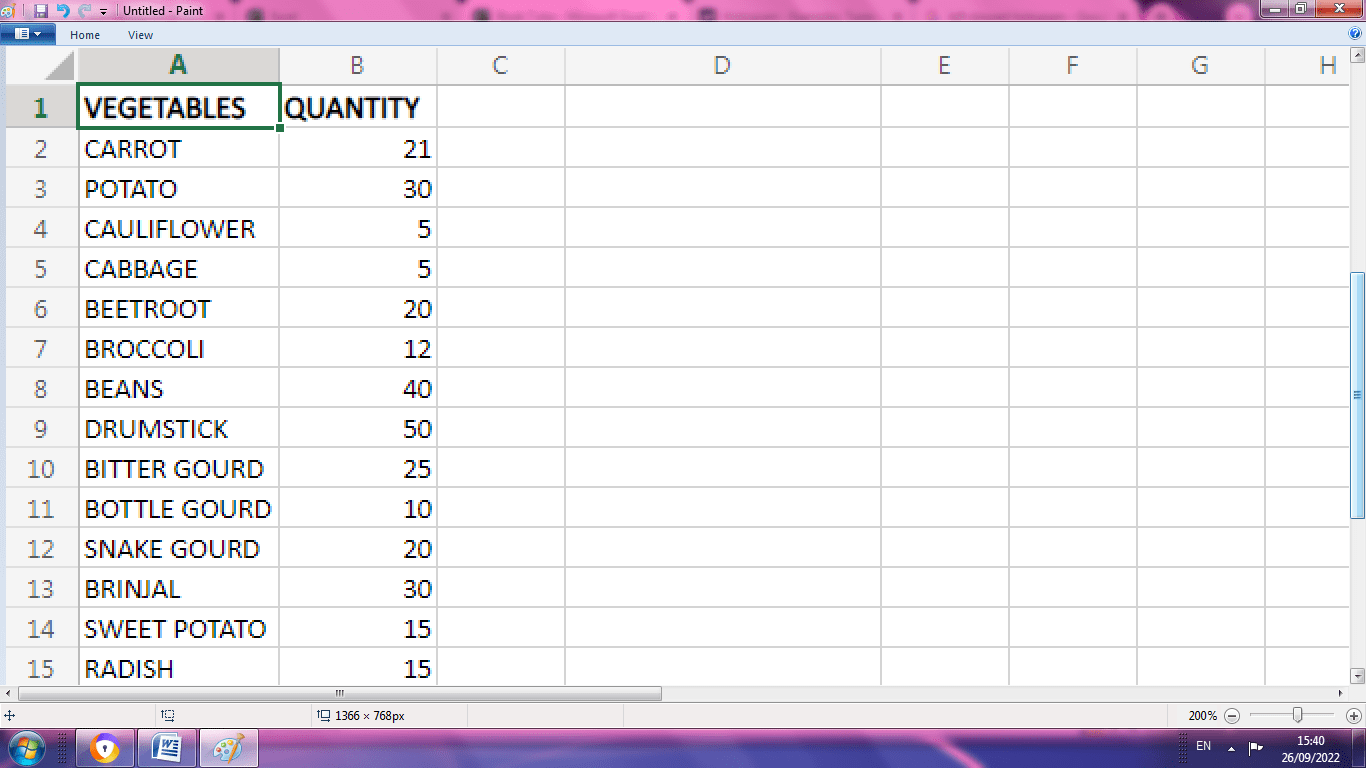
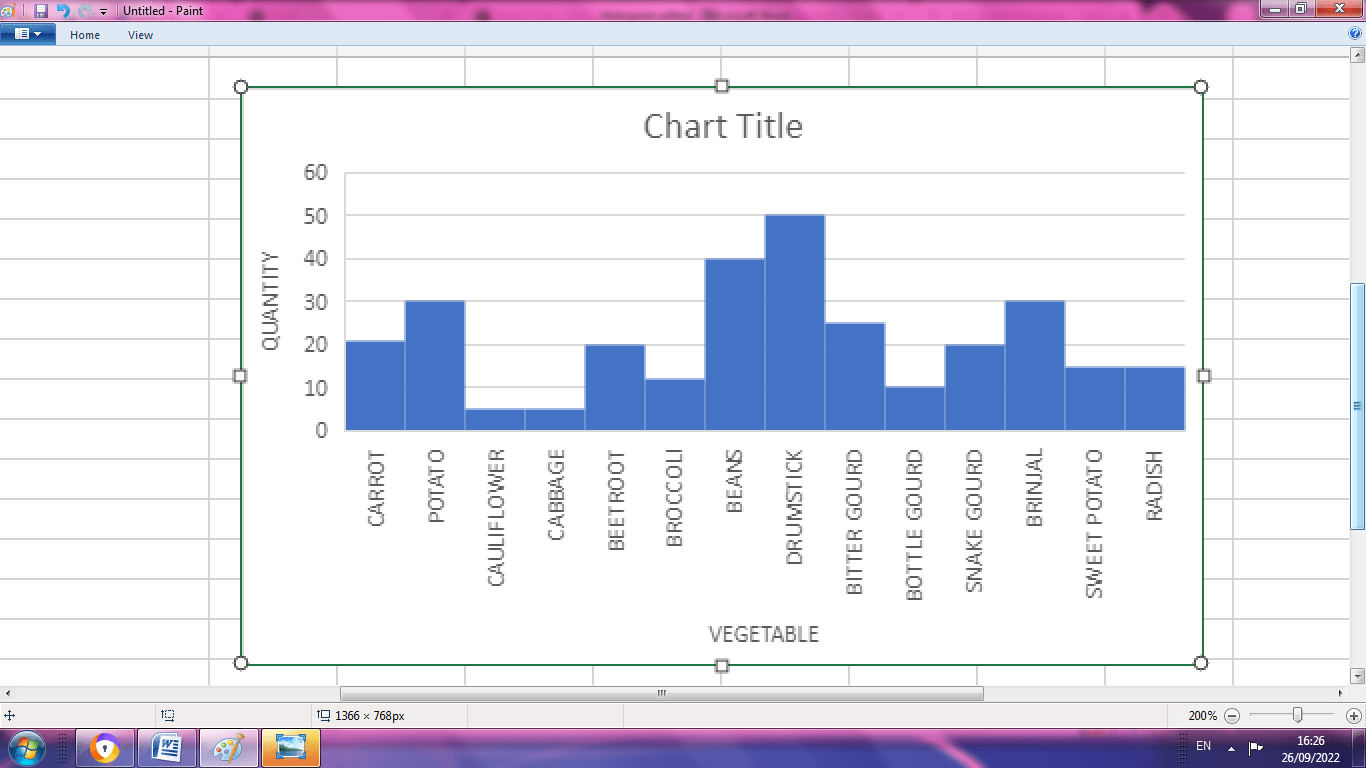
STEP 1: Enter the data in the spreadsheet. Here various vegetables and quantity of purchased is mentioned below.
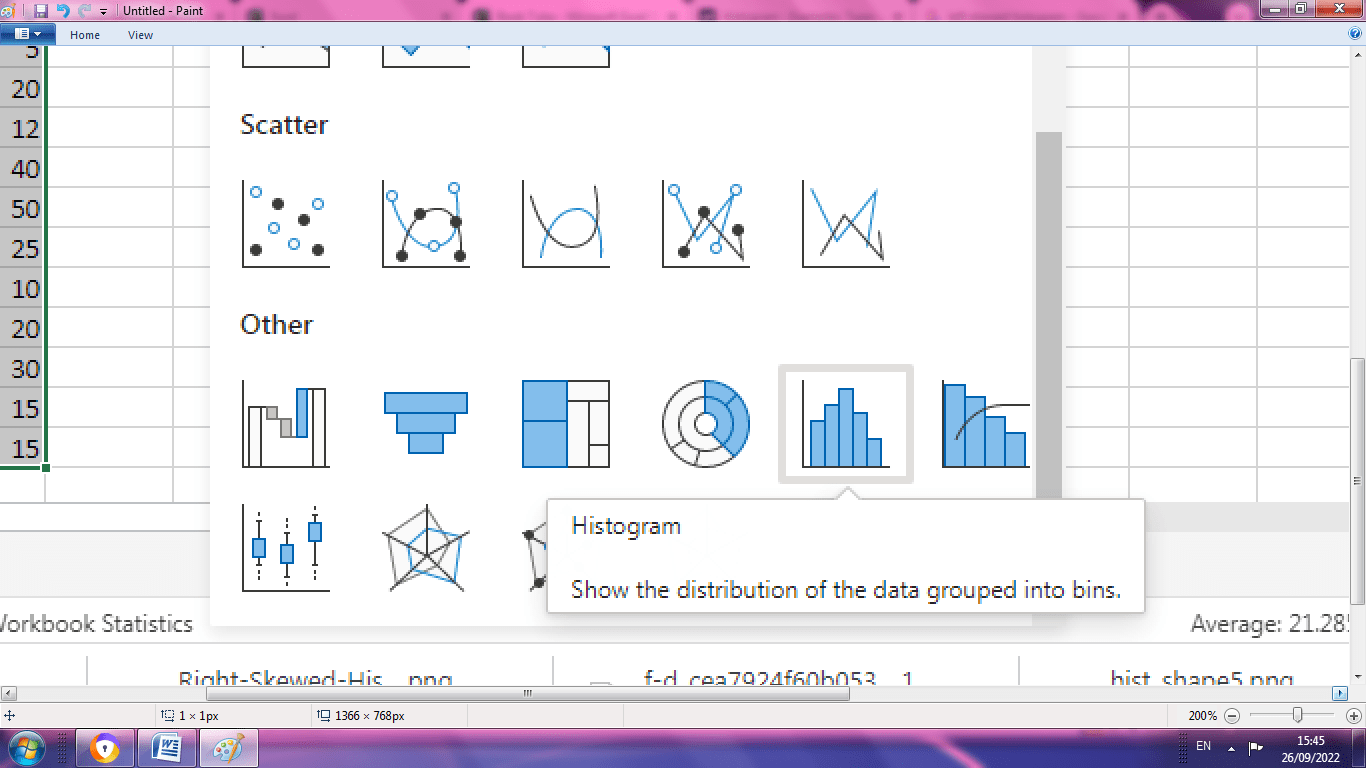
STEP 2: To create histogram, select the entire dataset. Choose>Insert tab>Chart>Histogram.
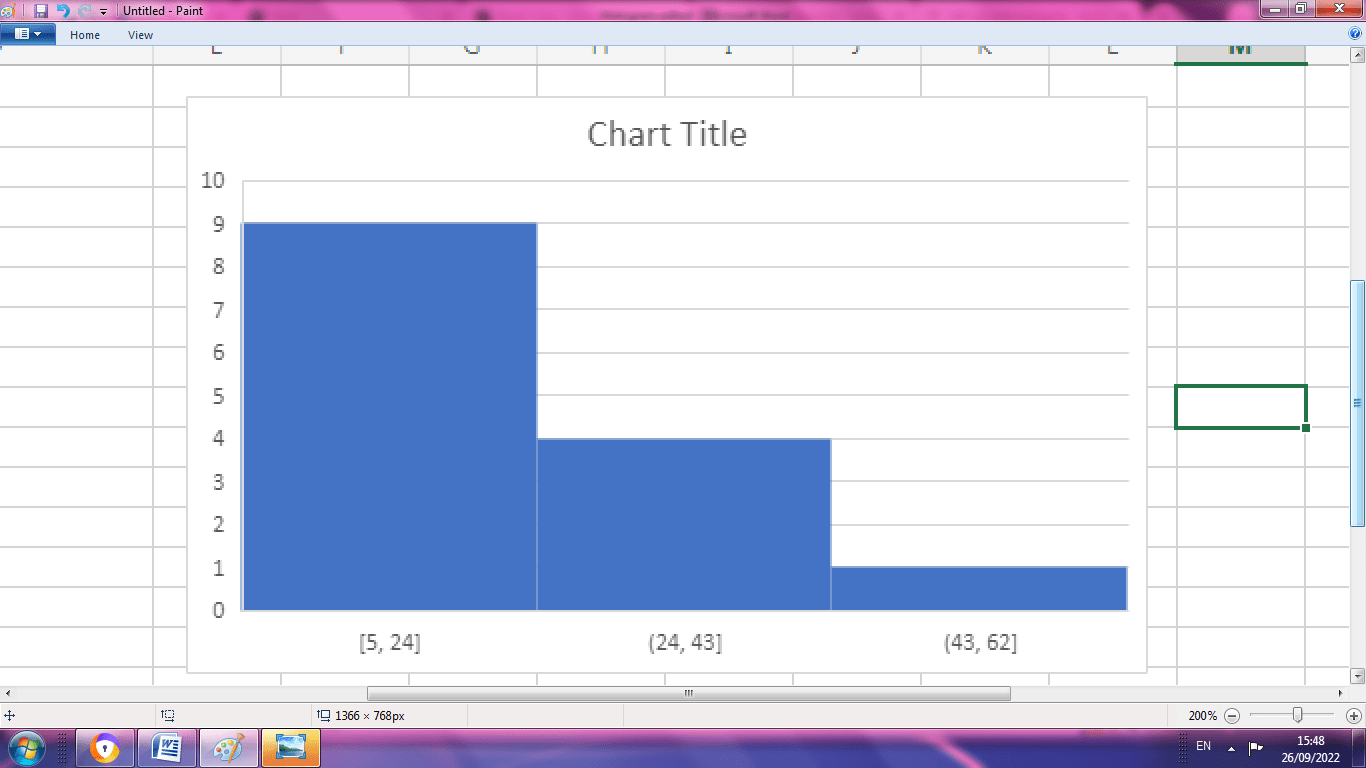
STEP 3: A histogram chart is created for given data.
STEP 4: Right click the chart, it displays the several options as shown below. You can change the histogram settings by choosing your desired color, title and gridlines.
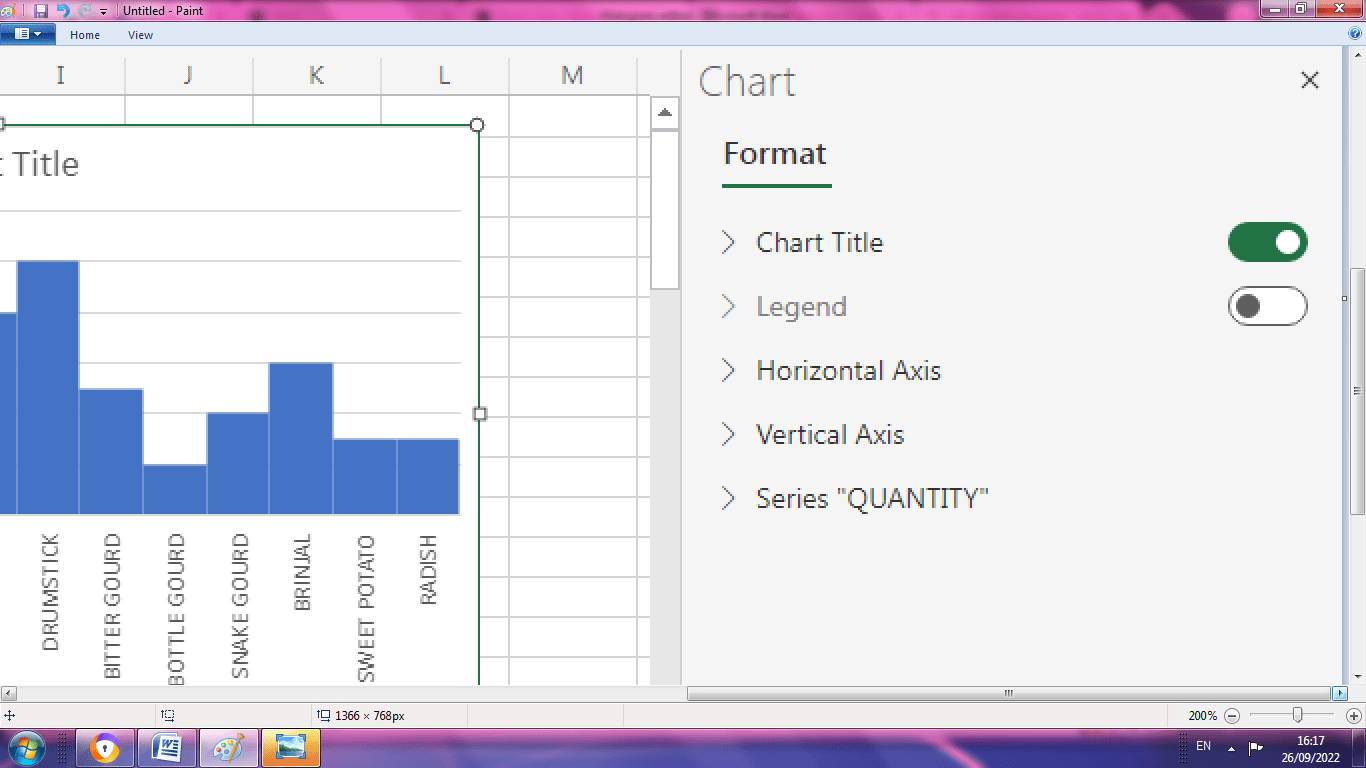
STEP 5: By using format option the horizontal and vertical axes are named.
Uses of Histogram
- The histogram is used to determine the data's mean, mode, distribution and median. Data is presented in different frequencies and types.
- The data presented should be in numerical form.
- The distribution shape is checked by using this method.
- The output is predicted using checking two or more process
- It is used to check whether it meets the customer's requirements.