
×

Excel Unique Values

The Unique function in Excel filters the list of unique values from the given data like range or array. The data presented is either number, text, date, time etc. This Excel Unique function comes under Dynamic Array Functions and splits the neighbouring cells in a horizontal or vertical manner. The unique values are extracted in various data such as numeric values, names in a separate column or a combination of both rows and columns.

Syntax

UNIQUE (array, [by_col].
[exactly once])

Parameter

Array – The unique values are obtained from this range or collection.

By_col - A logical value is presented and used to compare data.

  • True – It compares the data presented in columns
  • False – It compares the data presented in rows.

Exactly_once – A logical value is presented where it defines what values are considered unique.

  • True – It returns the value presented only once in the database notion of unique.
  • False – It returns the different values from the given set of data

Unique Formula in Excel

STEP 1: Enter the data in the spreadsheet.

Excel Unique Values

STEP 2: Select the range of cells to find the unique value. Click Data> Advanced Filter group from Sort & Filter group.

Excel Unique Values

STEP 3:  The advanced Filter dialogue box appears. In that, select "Copy to another location". A list range is chosen as A2:A10, and a cell is selected where the result will display. In the Copy to box, enter the cell chosen name.

STEP 4: Click the Unique Records Only. Press OK.
Excel Unique Values

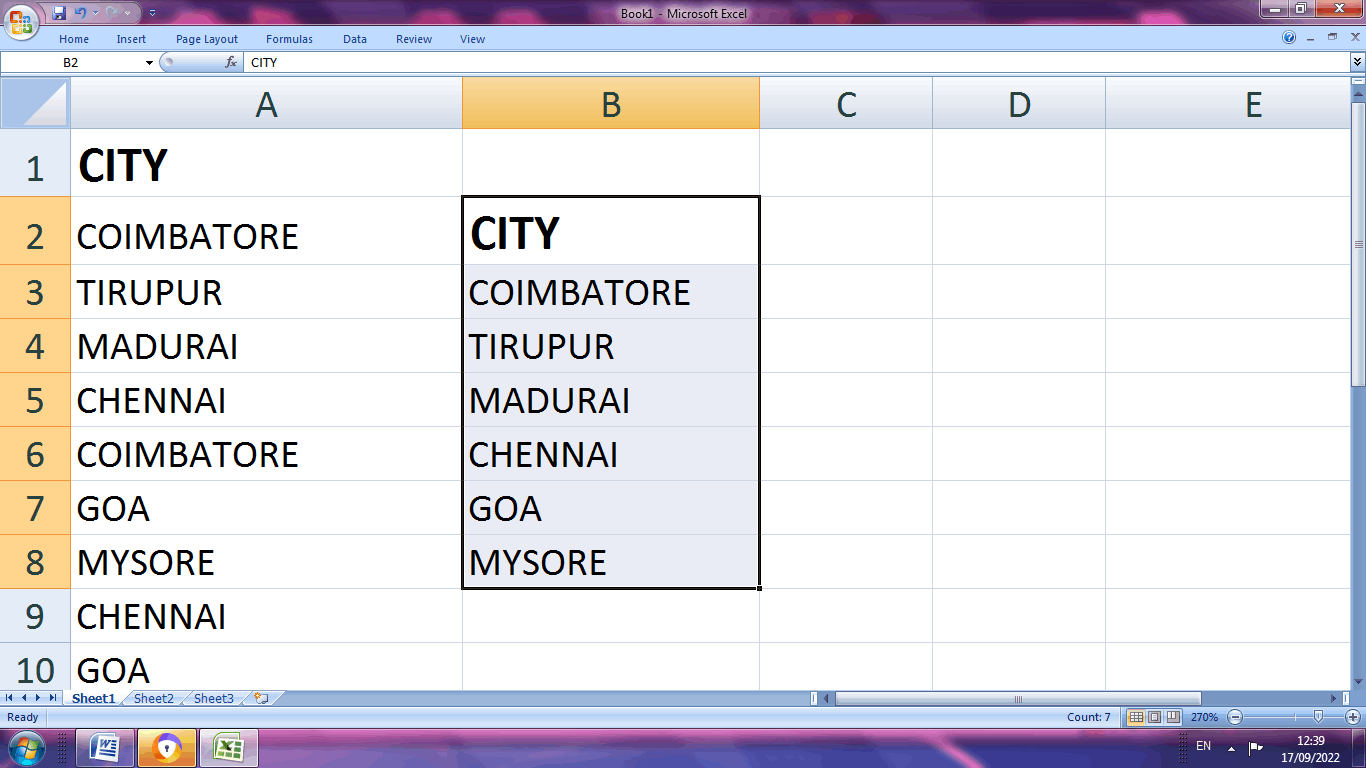
STEP 5: The result will be displayed in the above image, where the unique values are filtered.

In the above example, the duplicate values are removed from the cells C6, C9, and C10. This method is also used in Excel rows to remove duplicate values.

How to Filter the Unique Values in Excel?

There are several methods to filter the unique values in excel. This is one of the methods. The below steps are followed to filter the unique values in Excel.

STEP 1: Enter the data in the spreadsheet.
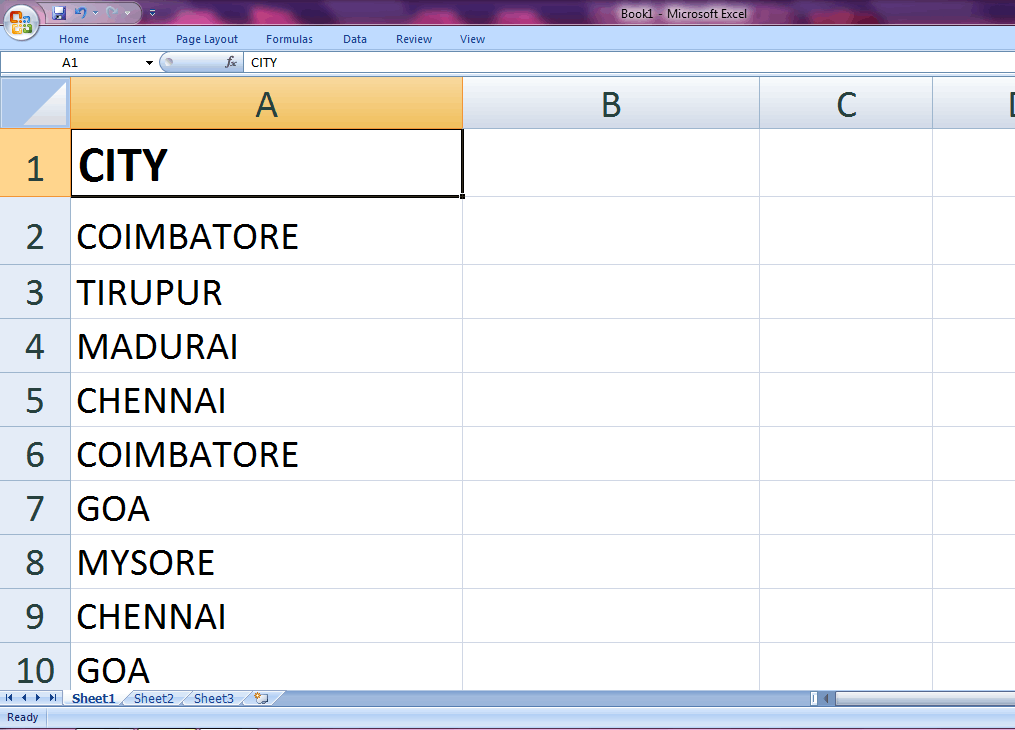
Excel Unique Values

STEP 2: Click the Advanced Option from Sort and Filter Group in the data Tab.

STEP 3: A dialog box appears in that choose "Filter the list in place" and select the listed range. Click the Unique Record Only. Press OK.

Excel Unique Values

STEP 4: The result will be displayed in the image below.

Excel Unique Values

The above example shows that cells A6, A9, and A10 are hidden, and the unique value is displayed while the duplicate values are hidden. Click the clear option in the Sort and Filter Group to bring the data back to its original position. The data returns to its original position.

How to remove duplicate values in Excel?

The duplicate values in Excel are removed by the following Method. The duplicate values are drawn either in a single column or a combination of rows and columns. Here Remove Duplicate Tool is used to find the special deals and delete the duplicate values.

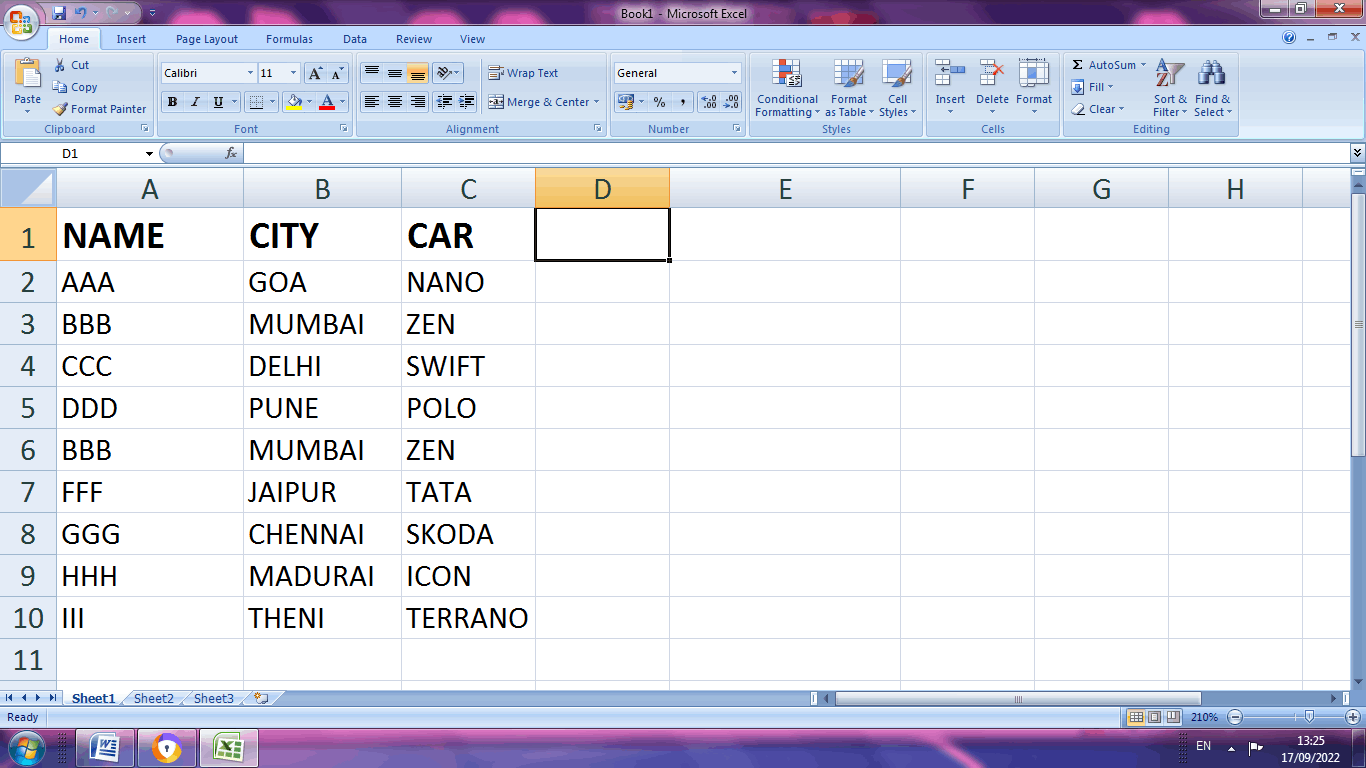
STEP 1: Enter the data in the spreadsheet.
Excel Unique Values

STEP 2: Choose the Remove Duplicates from the data Tools in the data Tab. After selecting the option, the Remove Duplicate option removes the identical data present in the spreadsheet.

Excel Unique Values

STEP 3: A Remove duplicate dialog box appears where that selects the name of the column to remove the duplicate values

Excel Unique Values

STEP 4: From the above image, the duplicate value is removed from cell A6, and the original values are arranged in an order.

Summary

The above tutorial discusses the functions and features of unique value. Various methods exist for finding the unique value and removing the duplicate value.


Related Topics

Excel File using Password

How to Protect an Excel File using Password? Nowadays Microsoft Excel is widely used by large organizations to small organizations for their personal and professional usage. They share files to various...

2 minutes read.

Count Cells with Text in Excel

Excel spreadsheets are widely used in many fields to store and analyze data. Usually, the cells present in excel are a combination of numbers and text. To perform the calculation...

3 minutes read.

Sum Every Nth Row in Microsoft Excel

The main and the critical use of the SUM Function is used to add all the amounts of the numerical data and thus efficiently produce the sum of all at...

3 minutes read.

How to use TODAY function in Excel

What is TODAY Function in Excel? Today function is one of the types of Worksheet function (WS) in Excel.Today Function belongs to the Date and Time functions.It is used to calculate...

3 minutes read.

Excel LEFT() Function

The LEFT () function in excel returns the leftmost characters from a text value. This function is used for data manipulation. Syntax LEFT(Text, [num_chars]) Parameter Text (required)- This parameter represents the string from which you want to...

1 minute read.

Excel INDEX () Function

Excel INDEX () Function The INDEX() function in excel returns a value from a list of tables based on the intersection of a row and a column position. This function is used with the...

2 minutes read.

SUM Functions in Excel

The BODMAS formula plays a vital role in the concept of mathematics. BODMAS rule follows the Bracket of Division, Multiplication, Addition and Subtraction. This rule is followed for a correct...

6 minutes read.

How to generate random numbers in Excel

In this tutorial, we will discuss the following things in detail that are as follows: Introduction about Random Numbers used in Microsoft Excel. Discuss how to generate the Random Numbers in Microsoft...

6 minutes read.

Excel WORKDAY() Function

Excel WORKDAY() Function The WORKDAY() function in excel returns the serial number of the date before or after a specified number of workdays. Syntax WORKDAY (START_DAY, DAYS, [HOLIDAYS]) Parameter START_DAY (required)- This parameter represents the...

1 minute read.

What do you understand by Combination Chart in Microsoft Excel?

In Microsoft Excel, an individual has the Combo Chart option available, which can be effectively clubbed into two charts types, which are Column Clusters Chart, Line Chart to get the...

7 minutes read.

Dependent Drop-down List in Excel

Excel forms are used to fetch data from the end user. When we have to give choices, we often use the drop-down feature of Excel. In this tutorial, we won’t...

7 minutes read.

Copying formula in Excel

Copy a formula in Excel While working with statistical calculations in Microsoft Excel, the user uses formulas to calculate the mathematical operations. Implementing these formulas manually for each data is a...

3 minutes read.

Gauge Chart in Excel

A Gauge Chart in Microsoft Excel is considered the meter type chart of a group dial chart, which is eventually similar to the speedometer that has the pointer towards the...

7 minutes read.

Nearest Multiple in Excel

In Excel, the values in Multiplication can be round up, down and to nearest Multiplication number using Excel default function. This makes the calculation to be performed in an easier...

3 minutes read.

Excel EXACT() Function

The EXACT() function in excel checks whether the specified values (texts, numbers) are exactly the same or not. It returns a Boolean value TRUE if the compared values are same, else it...

1 minute read.

Data Analysis in Excel

Data Analysis in Excel Data analysis is a powerful tool that helps the users to make better decisions by comparing different information. Microsoft Excel extends its credibility to enforce the data analysis tool...

6 minutes read.

Row Difference in Excel

Microsoft Excel is used for multiple purposes in various organizations. It is a combination of numeric values, alphabets etc. To calculate data, the user organizes the data according to their...

5 minutes read.

Excel Nested IF’s Function

Excel Nested IF’s Function This function in excel helps in checking multiple conditions together by using IF conditions within the IF condition. Syntax if(Logical_Test, [value_if_true], if(Logical_Test, [value_if_true] , [value_if_false])) Parameter Logical_Test (required)- This parameter represents the condition which...

2 minutes read.

Excel SECOND() Function

Excel SECOND() Function The SECOND() function in excel converts a serial number to SECOND (0 - 59). Syntax SECOND (SERIAL_NUMBER) Parameter SERIAL_NUMBER (required)- This parameter represents the date or time from which you want to extract...

1 minute read.

Purpose of Randomize in Excel

Excel spreadsheets are used on a large scale for business and personal usage. It is used to store data, perform multiple calculations, make assumptions based on charts and graphs etc....

7 minutes read.