Confusion Matrix Visualization Python
The confusion matrix is a two-dimensional array that compares the anticipated and actual category labels. These are the True Positive, True Negative, False Positive, and False Negative classification categories for binary classification.
If you've already fitted a logistic regression model, you may use the confusion matrix function in sklearn to automatically generate the matrix.
The following code generates a confusion matrix by fitting a Logistic Regression Model to the data. Predictors' data is in data frame X, whereas the target category's data is in data frame y.
SYNTAX
from sklearn.linear_model import LogisticRegression

from sklearn.metrics import confusion_matrix

#Fit the model

logreg = LogisticRegression(C=1e5)

logreg.fig(X,y)

#Generate predictions with the model using our X values

y_pred = logreg.predict(X)

#Get the confusion matrix

cf_matrix = confusion_matrix(y, y_pred)

print(cf_matrix)
OUTPUT
array([[23,  5],

       [ 3, 30]])
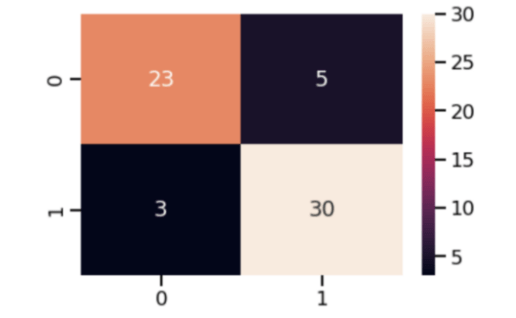
The results are accurate, but the presentation is a disgrace. Fortunately, we have access to a heatmap from the Seaborn library that makes it look good.
SYNTAX
import seaborn as sns

sns.heatmap(cf_matrix, annot=True)
OUTPUT
See the pie chart to see what percentage of your data is in each of the four corners.
This is how it's done:
SYNTAX
sns.heatmap(cf_matrix/np.sum(cf_matrix), annot=True,

            fmt='.2%', cmap='Blues')
OUTPUT
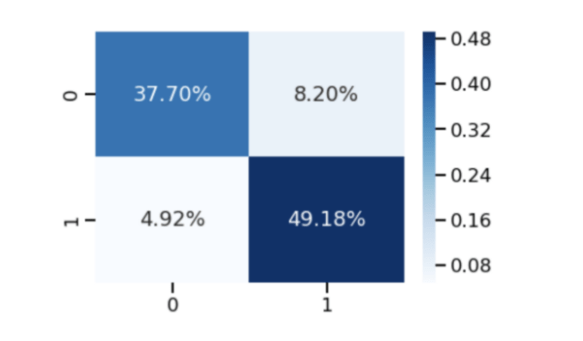
Likewise, this is rather cool. I even used the cmap property to alter the colour to something more pleasing to the eye... What if I want to view both the count and the percentage at the same time? Is there a way for me to view a label as well? Fortunately, the seaborn heatmap's annotation field can accept text labels.
Making a heatmap with labels:
SYNTAX
labels = [‘True Neg’,’False Pos’,’False Neg’,’True Pos’]

labels = np.asarray(labels).reshape(2,2)

sns.heatmap(cf_matrix, annot=labels, fmt=‘’, cmap='Blues')
OUTPUT
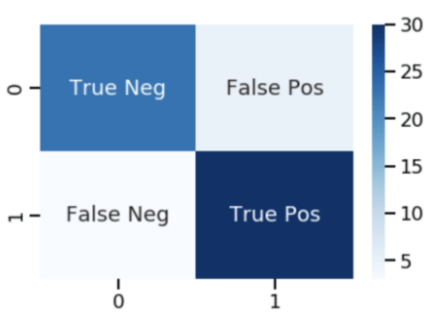
This is very neat. The fmt field was included to prevent formatting from being applied to the manual label. … However, as a result of using this visualisation, I've been stripped of all the relevant details.
With the annotation string's ability to add a new label, I realised I could build custom labels with all the information I wanted.
Strings that include all of the information I need can be created and applied to the heatmap to show it all at once, if that's possible.
SYNTAX
group_names = [‘True Neg’,’False Pos’,’False Neg’,’True Pos’]

group_counts = [“{0:0.0f}”.format(value) for value in

                cf_matrix.flatten()]

group_percentages = [“{0:.2%}”.format(value) for value in

                     cf_matrix.flatten()/np.sum(cf_matrix)]

labels = [f”{v1}\n{v2}\n{v3}” for v1, v2, v3 in

          zip(group_names,group_counts,group_percentages)]

labels = np.asarray(labels).reshape(2,2)

sns.heatmap(cf_matrix, annot=labels, fmt=‘’, cmap='Blues')
OUTPUT
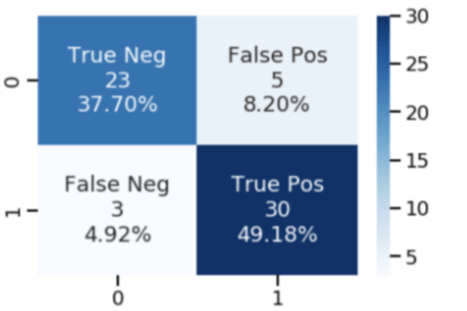
This is amazing, I tell you what! I have a list of names, numbers, and percentages for various groups.
That being the case, what if I combined it all into a single function with visibility choices for each argument, as well as some additional seaborn options like the colormap or displaying a colour bar? What if I included a few summary statistics like Accuracy, Precision, Recall, and F-Score? That would be really convenient. As a result of these considerations, I developed a function that performs the desired action.
The function expects a 2-D Numpy array as input, which represents a confusion matrix. There are a slew of choices for customising the output. By default, everything is displayed (rather than hidden). The function's documentation includes a docstring that lists all available parameters. To make things easier, I've provided the following docstring:
This function will make a pretty plot of an sklearn Confusion Matrix cm using a Seaborn heatmap visualization.
SYNTAX
Arguments

---------

cf:            confusion matrix to be passed in

group_names:   List of strings that represent the labels row by row

               to be shown in each square.

categories:    List of strings containing the categories to be

               displayed on the x,y axis. Default is 'auto'

count:         If True, show the raw number in the confusion matrix.

               Default is True.

normalize:     If True, show the proportions for each category.

               Default is True.

cbar:          If True, show the color bar. The cbar values are

               based off the values in the confusion matrix.

               Default is True.

xyticks:       If True, show x and y ticks. Default is True.

xyplotlabels:  If True, show 'True Label' and 'Predicted Label' on

               the figure. Default is True.

sum_stats:     If True, display summary statistics below the figure.

               Default is True.

figsize:       Tuple representing the figure size. Default will be

               the matplotlib rcParams value.

cmap:          Colormap of the values displayed from

               matplotlib.pyplot.cm. Default is 'Blues'