Python for Data Analysis
Data analysis uses various techniques to read, illustrate, manipulate and evaluate a particular data. You can have access to the data and keep the data updated regularly. You can append new values or suspend the values from the data. There are six basic steps in data analysis which are:
- Specify data requirements
- Collect or prepare data
- Process and clean
- Analyze
- Share
- Report
For every process, there is a tool to work with.
In Python, we can use various packages for data analysis like NumPy for numerical data analysis, Pandas for Tabular data, Matplotlib for visualizing data, and Exploratory analysis.
NumPy for numerical analyzing
NumPy is also called numerical Python. NumPy is one of the open-source libraries of Python. We primarily use NumPy for arrays and some main functions in linear algebra, matrices, and statistics.
In data analysis, we use NumPy arrays, a table of elements. As it is an array, it will only store similar data types. The dimensions of the array are taken as the rank of the array.
To create a NumPy array, we use the below code:
Code
import numpy as np
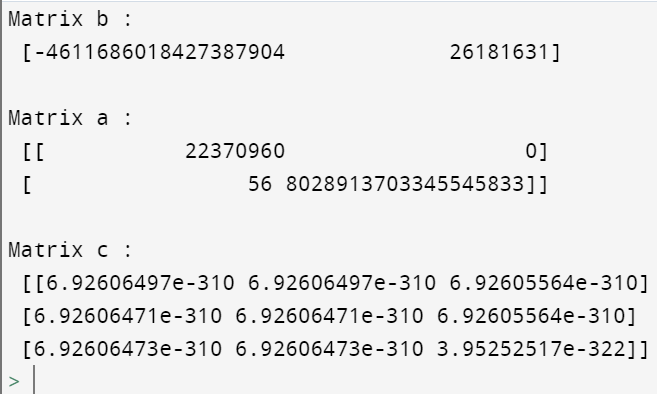
B = np.empty(2, dtype = int)
print("Matrix b : \n", B)
A = np.empty([2, 2], dtype = int)
print("\nMatrix a : \n", A)
C = np.empty([3, 3])
print("\nMatrix c : \n", C)
Output:
Further, you can do many airthematic operations on NumPy arrays like
- Addition: you can add two arrays using add function. Defining (a+b)
- Subtraction: you can subtract two arrays using a sub-function. Defining (a-b)
- Multiplication: you can multiply two arrays using the mul function. Defining (a*b)
- Division: you can divide one array from another using the div function. Defining (a/b)
You will also try array indexing, array slicing, and array broadcasting.
Pandas for tabular data:
Pandas is one of the best libraries in Python used to work with data sets containing functions for analyzing, cleaning, exploring, and manipulating the given data. The definition of "Pandas" has a reference in "Panel Data" and "Python Data Analysis" and was created by Wes McKinney in 2008.
Python with Pandas is used in many fields, including academic and commercial, finance, economics, Statistics, analytics, etc.
We import pandas using the following command:
import pandas as pd
Pandas help in writing less amount code every time a method is called. In pandas for data manipulations, we get two data structures which are:
- Series: This is a one-dimensional labeled array used to hold data of any type. This Series acts like a column in an excel sheet.
The command we use for this function is Series().
Example code:
import pandas as pd
import numpy as np
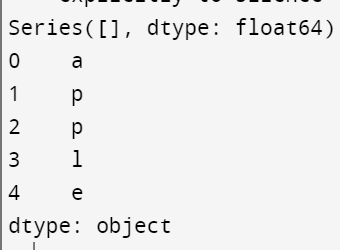
# Creating an empty series
A = pd.Series()
print(A)
# simple array
data = np.array(['a', 'p', 'p', 'l', 'e'])
A = pd.Series(data)
print(A)
output:
- Data frame: this is a two- dimensional size, mutable. This data is aligned in a tabular form consisting of rows and columns. This will be created using the function Datafram(). Let us look at an example code
Code:
import pandas as pd
# Calling the DataFrame method
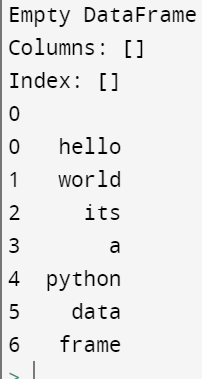
df = pd.DataFrame()
print(df)
# list of strings
A = ['hello', 'world', 'its', 'a',
'python', 'data', 'frame']
# Calling DataFrame constructor on the list
df = pd.DataFrame(A)
print(df)Output:
Further, you can make some operations in data frames like
- Filtering: this is used to subset rows or columns of a data frame. This can be used by the function data frame.filter().
- Sorting: This is used to sort the data frame in either ascending or descending order. The syntax of this is sort_values().
- Groupby: this is used to categorize the data. This will be used in real-life projects.
- Concatenating: used to concatenate the data frames. Syntax of this is concat().
Matplotlib for visualizing data
Matplotlib is Python's best visualization library for developing 2D plots of an array. This library is built on NumPy. We can create several plots like line graphs, bar graphs, scatter plots, and histograms.
Pyplot is a matplotlib module that gives an interface. All functions of pyplot are used to create figures, decorate a plot with, creating plotting areas.
Let us look at an example code for plotting
Code:
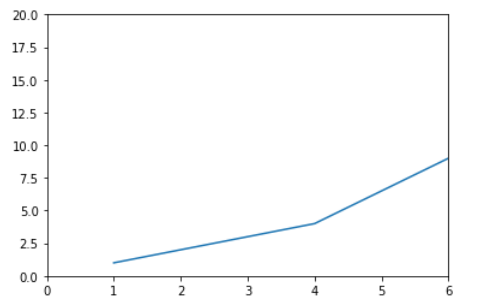
# python program to execute pyplot module
import matplotlib.pyplot as plt


plt.plot([1, 4, 6, 8], [1, 4, 9, 16])
plt.axis([0, 6, 0, 20])
plt.show()
Output:
You can also create many more graphs like pie charts, bar graphs, histograms, scatterplots, box plots, and correlation heat maps.
Exploratory Data analysis
EDA- this is one of the techniques to analyze the data using a few visual techniques. With this method, we will get detailed information on the statistical summary of the data. With this, we will be able to manipulate the duplicate values and a few patterns.