EDA in Python
The EDA is the exploratory data analysis; the data scientists mainly use the EDA to understand the main features of the data quickly, the variables in python and the relationship between them, and it also helps identify the important variables to our problem statement. The data analysis can be done in both a graphical and a non-graphical manner. The graphical method includes organizing the data in bar graphs, scatter plots and correlation plots. The non-graphical method includes organizing the data in the form of the data frames and with many other functions such as shape, isnull and other datatypes. The data organization is generally divided into three types.
- Descriptive Statistics
- Group data
- ANOVA
- Correlation plots and methods.
Descriptive Statistics: This method is used to organize the data descriptively, giving brief details of the data with the help of some methods and variables in the languages.
Group data: This method includes the data in the form of groups. Each data is divided into different groups based on different characteristics.
ANOVA: It is the statistical method of organizing the data based on the variance of the data. The ANOVA test is mainly used to accept the data based on the null hypothesis and reject the data in the alternate hypothesis.
Correlation plots and methods: The correlation plots are used to compare one group of data with the other form of the data in the graphical form based on the regression coefficient; the correlation plots are plotted mainly with the help of the scatter.plot( ) methods.
Descriptive Statistics
Descriptive statistics are mainly used to understand the data in a more accessible manner quickly. In python, pandas consist of the describe( ) method or function to organize the data. The describe function helps perform the statistical operations on the data, such as standard deviation, the total number of data values in the given data, the mean of the data, and the minimum and maximum values of the provided data.
Syntax:
DF.describe( )
Example:
Now let us find all the statistical values of the different data sets in the given data with the help of describe( ) function. To perform this operation first, we need to import the libraries such as pandas and numpy, and then we need to collect the data in the form of pandas dataframe then, with the help of describe( ) function, we can find all the statistical values of the given series of data.
Code:
#Importing the libraries
import pandas as pd
import numpy as np


#collecting the data in the form of arrays
data = np.array([10, 20, 30, 40, 50], [3, 5, 7, 9, 11], [10, 15, 20, 25, 30])


#Arranging the data in the form of dataframe
DF = pd.DataFrame(data)


#Using the describe function
DF.describe()
Output:
              age 	pages        students_class
count 55      5
mean          30           720
min          10            3	              10
max          50           11                   30
std          15.8         3.16              7.905
25%          12.5	 2.75	             7.5
50%           25	 5.5	              15
75%           37.5	 8.25                22.5
We also have another function or method, value_counts( ), which is used to calculate the statistical data about each category. If we contain a series of data in a given dataframe, we can calculate all the statistical values of a particular data series using the value_count( ) function.
To perform this operation, first, we need to import the libraries such as pandas and numpy, and then we need to collect the data in the form of a pandas dataframe; then, with the help of the value_counts( ) function, we can find all the statistical values of the given set of values in the given dataframe.
Example:
#Importing the libraries
import pandas as pd
import numpy as np


#collecting the data in the form of arrays
data = np.array([10, 20, 30, 40, 50], [3, 5, 7, 9, 11], [10, 15, 20, 25, 30])
#Arranging the data in the form of dataframe
DF = pd.DataFrame(data)
#Using the value_counts( ) function
DF[“age”].value_counts( )
Output:
	age
count     5
mean     30
min 	10
max	50
In descriptive statistics, we have another boxplot method: the graphical representation of the data in the form of bar plots. To perform this operation, we need to import the matplotlib library. This is the best method because we can understand the data easily in the pictorial form.
Code:
#importing the libraries
import pandas as pd
import matplotlib.pyplot as plot


#Collecting the data
DF = pd.read_csv(“data”)


#Collecting the data in the form of list
x = list(DF.population)


#plotting the data
plt.boxplot(x)


#displaying the data
plt.show( )
Output:
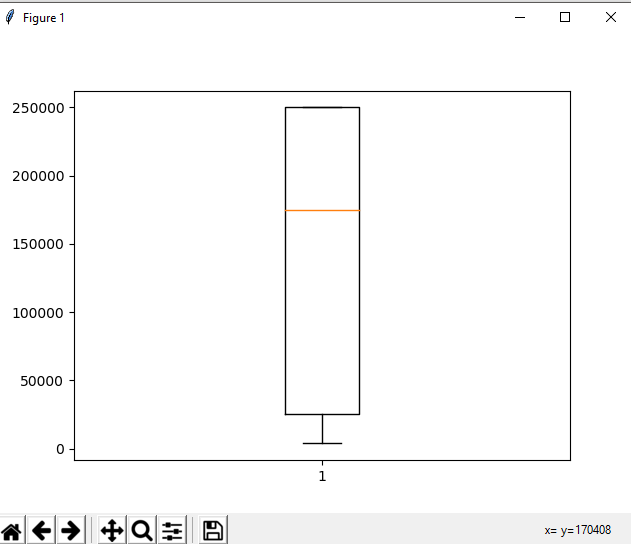
Here we can easily find the mean of the data from the bar plot, we can find the maximum value from the plot and also we can easily find the minimum plot of the data. This is the most efficient way of organizing the data and finding the statistical measures of the data quickly.
Group Data
This type of method is very effective, available in python pandas and helps calculate all the statistical data of the given dataset. We can also find the statistical calculation of each set separately, such as we can find the mean and we can also find the standard deviation of the data separately.
Syntax:
#For finding the mean of a group of data
DF.group([group_name]).mean( )


#For finding the standard deviation of the group of data
DF.group([group_name]).deviation ( )
Parameters:
DF: Data frame in the pandas
Group: Name of the dataset
group_name: The name of the group in the dataset
Example:
#Importing the libraries
import pandas as pd
importnumpy as np


#collecting the data in the form of arrays
data = np.array([A, C, D], [P, Y, T, H, O, N])


#Arranging the data in the form of dataframe
DF = pd.DataFrame(data)


#Using the mean function
DF.group([‘age’, ‘pages’]).mean
Output:
                         Population   income
age       pages
A         P              12334.22	18792
          Y            12345.33         12344
          T             13469.32        54567
          H             15672.89	43246
          O             13468.98	12345
          N              16789.78	17896
C         P		17678.88	12345
          Y		15676.76	17678
          T	        13456.76	16854
	H	        14567.78	16532
	O	        16574.67	18743
	N	        19875.55	17643
D	P	        20876.22	16543
	Y               21345.78	19752
	T	        14567.88	66561
	H	        16775.99	17642
	O	        17665.98        13345
	N	        21338.87	97643
Here we can find the mean of the group by group data using the group data. In the same way, we can find the variation of the data using the group data. So we can say that the group data method is the most efficient way of finding the statistical values of the data.
ANOVA
It is the statistical method of organizing the data based on the variance of the data. The ANOVA test is mainly used to accept the data based on the null hypothesis and reject the data in the alternate hypothesis.We first need to import the scipy libraries to perform the ANOVA operation. Then we need to collect the data in the form of lists or any data type in python; with the help of the f_oneway( ) function, we can perform the one-way ANOVA test and analyze the data. The ANOVA will return two test results they are:
- F– testscore: This method will calculate the variation of the group means over the total variation of the data.
- p-value:This method will return the main result of the given data. This operation can be performed by importing the scipy module and with the help of the f_oneway( ).
Syntax:
f_oneway(datatypes)
Parameters:
Datatypes: These are the data for which we need to find the statistical values of the values.
Example:
#Importing the library
fromscipy.stats import f_oneway


#values for which we need to find the statistical values of the data.
Value1 = [76, 65, 55, 87, 66]
Value2 = [55, 87, 66, 79, 90]
Value3 = [67, 98, 32, 76, 92]


#using the f_oneway function to perform the one-way ANOVA
f_oneway( Value1, Value2, Value3 )
Output:
F_onewayResult(statistic=2.54678832, pvalue= 0.0365488686)
From the output, we can find the Fstatistic data and p-value are 2.55 and 0.03. As we can find that the p-value is less than 0.05 so, we need to reject the null hypothesis, we need to reject the null hypothesis.
Correlation plots and methods:
The correlation plots are used to compare one group of data with the other form of the data in the graphical form based on the regression coefficient; the correlation plots are plotted mainly with the help of the scatter.plot( ) methods.
This method can be analyzed using graphical and non-graphical ways of analyzing the data. The Pearson method is the non-graphical method of analyzing the data. To analyze the data, we require the Pearson coefficient and the p-value; the data are said to be strongly correlated if the Pearson coefficient is near 1 or -1 and if the p-value is less than 0.001.