Python sklearn train_test_split
Sklearn:
One of the most beneficial open-source libraries for learning algorithms in Python is, without a doubt, Sklearn or Scikit-Learn. The most effective tools for statistical modeling and machine learning are all included in the scikit-learn library. SciPy, NumPy, and Matplotlib are the foundations upon which the scikit-learn package is predominantly created in Python. The library implements multiple pre-processing, machine learning, visualization, and cross-validation methods using a single and consistent Python interface. Scikits by David Cournapeau, a French research scientist. The scikit-learn project was started as a Google Camp of Code project called Learn. Its name alludes to the notion that it is an independently developed and published SciPy toolkit modification known as "SciKit" (SciPy Toolkit). Later, the basic codebase was rewritten by additional programmers. Alexandre Gramfort, Gael Varoquaux, Vincent Michel, and Fabian Pedregosa oversaw the project in 2010 at the French Institute for Research in Computer Science and Automation in Rocquencourt, France. The organization released the project's official release on February 7 of that year. Scikit-learn and Scikit-image are given as illustrations of programs that have been "well-maintained and popular" in November 2012. Python's scikit-learn is one of the most popular machine-learning libraries on GitHub.
How Sklearn is Implemented:
Scikit-learn is mostly written in Python, and significantly, users use the NumPy module for computations involving arrays and linear algebra. To further the effectiveness of this library, some basic algorithms are also written in Cython. Utilizing wrappers created in Parameters for LIBSVM and LIBLINEAR, support vector machines, regression models, and linear SVMs are done. In certain conditions, expanding these functions with Py might not be practical. Scikit-learn integrates well with many wide ranges of other Modules, including SciPy, Pandas data frames, Pandas for array template matching, Matplotlib, seaborn, and plotly for graphing, among many more.
Important topics:
- Algorithms for Decision Making: Data are recognized and arranged into groups based on patterns. Regression is the technique of predicting or forecasting data using the average of past and future data.
- Numerous methods, such as simple linear regression and artificial neural for pattern recognition, support predictive analysis. Compatibility with the Matplotlib, Pandas, and NumPy libraries
- Using machine learning (ML), a predictive model can be created or built on computer input data, doing away with explicit programming requirements. Machine learning is a part of AI.
One of the main motivations for utilizing open-source software is the sizeable community, and Sklearn is similar in this sense. The Python scikit-learn library for Python has had about 35 contributors, with Andreas Mueller being the most notable. Numerous Organizations, such as Evernote, Inria, and AWeber, are recognized as clients on the scikit learn home page. However, the actual use rate is substantially greater.
Characteristics:
The software package offers efficient and user-friendly functionality for machine learning and data mining techniques. Additional regression, classification, and clustering algorithms are included, such as support vector machines(SVM), gradient boosting algorithms, random forest algorithms, and k-means. The package is freely available, open source, and reusable in various settings. It is based on the SciPy, Matplotlib, and NumPy libraries. The software has a BSD license that can be used in business settings.
Advantages of Sklearn:
Whether you're looking for an ML overview, want to come up to speed quickly, or want the latest recent ML learning tool, scikit-learn is well-organized and simple to grasp. You may easily create a predictive analysis model and apply it to fit the gathered data with the aid of this high-level toolbox. It is flexible and gets along nicely with other Python libraries. The BSD license that governs its distribution makes it legally and legally unrestrictedly free. It's simple to use. The scikit-learn toolkit is incredibly useful and versatile and may be used to create neuroimages and forecast consumer behavior, among other practical uses. Scholars, contributors, and a sizable online community worldwide support and update Scikit-learn. Users who want to connect the techniques with their systems can find comprehensive API documentation on the scikit-learn website.
Disadvantages:
For in-depth learning, there are better options than this. Both string processing and graph methods are not well suited for it. For instance, scikit-learn does not include a built-in method to create a straightforward word cloud. Because Scikit-learn lacks a robust linear algebra library, scipy and numpy are employed.
Installation:
When installing the scikit-learn library, verify that NumPy and SciPy are already installed on the computer. Once Arithmetic and SciPy have been successfully installed, pip is the easiest way to install scikit-learn.
$ pip install -u scikit-learn
Importing the dataset:
We recently spoke about the Diabetes Dataset and the one we'll include in this Sklearn tutorial. Scikit Learning Python already contains this data set. Thus we don't need to obtain it from an outside site. The commands listed below must be used to import the Scikit-Learn and Pandas modules before we can import the dataset.
The Diabetes dataset of sklearn may be rapidly imported using the command line after importing sklearn.
CODE:
import sklearn
import pandas as pd
from sklearn.datasets import load_diabetes
diabetes = load_diabetes()
df = pd.DataFrame(diabetes.data, columns = diabetes.feature_names)
Displaying the top 10 attributes and tuples from the dataset:
#head includes the top values of the dataset.
 df.head(10)
OUTPUT:
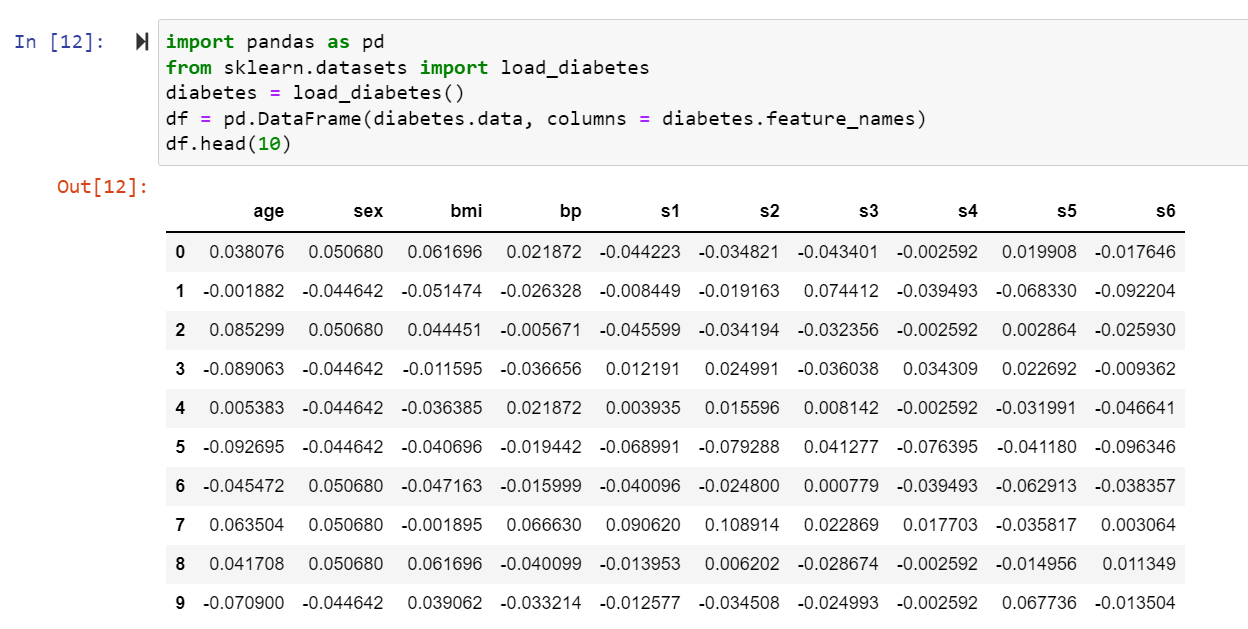
Features:
The factors in our dataset—often referred to as predictors, data inputs, or attributes—are what we refer to as features. A feature space can represent them, commonly represented by the letter "X," as there may be many of them. A list of all the feature names is what is meant by the term "feature names."
Response:
The variables' characteristics determine this variable's output. Most of the time, we have one answer column, represented by a reaction section or vector (the letter "y" is usually used to symbolize a response vector). Target names describe all the possible values that a response vector might have.
Splitting the dataset:
To save some unobserved data from verifying the model's accuracy, we can split the entire dataset into two parts: a training dataset and a testing dataset. After the model has been trained with the training set, test or validate it using the testing dataset. The performance of the trained model can then be evaluated. In this case, the data will be split at 70:30, with 70% of the data used for training a model and 30% used for testing it. The example uses the same dataset as the one from the previous section.
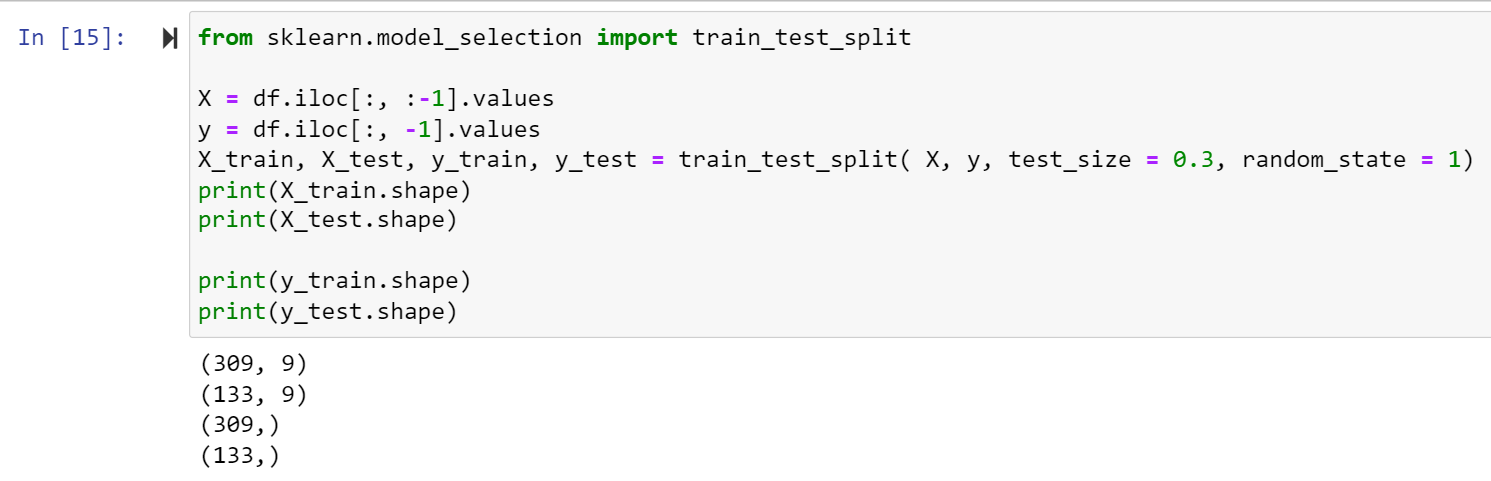
Importing train_test_split from sklearn.model_selection and separating the data into dependent and independent features, then after we create a testing dataset of size 0.3 times the entire dataset.
CODE:
from sklearn.model_selection import train_test_split
X = df.iloc[:, :-1].values
y = df.iloc[:, -1].values
X_train, X_test, y_train, y_test = train_test_split( X, y, test_size = 0.3, random_state = 1)
print(X_train.shape)
print(X_test.shape)

print(y_train.shape)
print(y_test.shape)
OUTPUT:
Model Training:
After that, we may use our dataset to build a forecasting model. As was already noted, scikit-learn provides a wide range of contemporary machine learning algorithms with a uniform user interface for fitting and estimating the Accuracy, Precision, Recall, and F1 scores.
A decision tree mimics a flowchart with nodes representing features (or properties), branches representing decision functions, leaf nodes representing features (or properties), branches representing decision functions, and leaf nodes representing conclusions. In a decision tree, the root node is the first node from the top. Data division based on attribute values becomes possible. The procedure of continuously dividing a tree is known as recursive partitioning. Making decisions is aided by this flowchart-like architecture. It wonderfully captures how people think and looks like a flowchart. Because of this, decision trees are straightforward to understand and comprehend.
CODE:
import numpy as np
from sklearn.datasets import load_iris
from sklearn.tree import DecisionTreeClassifier
from sklearn.model_selection import cross_val_score, train_test_split
X, Y = load_iris( return_X_y = True )
X_train, X_test, Y_train, Y_test = train_test_split(X, Y, test_size=0.4, random_state=0)
dtc = DecisionTreeClassifier(random_state = 0)
dtc.fit(X_train, Y_train)
score = cross_val_score(dtc, X, Y, cv = 10)
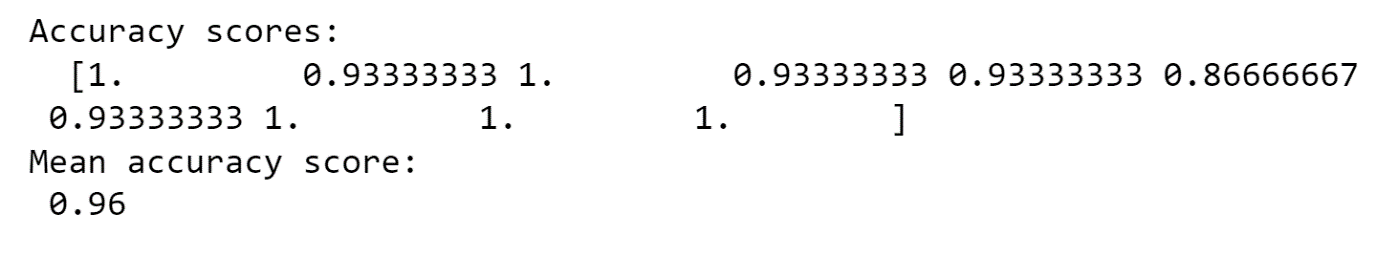
print("Accuracy scores: \n ", score)
print("Mean accuracy score: \n", np.mean(score))
CODE EXPLANATION:
Importing all the required libraries, which are numpy, sklearn, and from sklearn importing decision tree classifier (Decision trees are typically designed to mimic how people think when making decisions, making them simple to comprehend) and iris dataset. After importing the modules, we load the dataset and split the data into test and train data. The training data consists of 70 percent of the data, and the test data consists of 0 percent of the data for predictive and accurate model generation. Accuracy and mean accuracy scores give the model accuracy with floating values.
OUTPUT: