Python Support
Python
Python is an interactive and more accessible language than any other programming language. The python programming language uses a variety of libraries to perform the operations in a faster way. The python language can also be used in web development; Django and Flask are the frameworks used to create web applications using Python. In Python, indentation is the main concept; if we do not follow proper indentation, the code may not run.
We can easily create an application in Python if we are familiar with indentation, Variables, Operators, loop concepts and function concepts in python language. The python programming language has pre-installed modules which help perform various operations; one of these modules helps in the support and resistance of the stock market prices.
Support and Resistance
The support and the resistance values are the most important values in the stock market. Based on the support and the resistance level in the stock prices, we can predict whether the stock prices are increasing or decaying with time. This support and the resistance values can be easily found with the help of the python programming language. The python programming language contains many built-in functions and modules that will help us predict stock prices.
- Support: The support value will indicate that the stock prices have reached the supporting level that supports the market values, and these values will tend to bounce back.
- Resistance: The resistance level will act as the threshold level when the prices in the stock market reach the resistance level; from then, these values will rise to the support level, which is the higher level in the stock prices. The resistance level will act as the ceiling when the prices reach this level and tend to rise to the support level. When the prices reach the breakout point, the prices will cross the resistance level and then reaches the support level, and finally, the resistance level will become the support level.
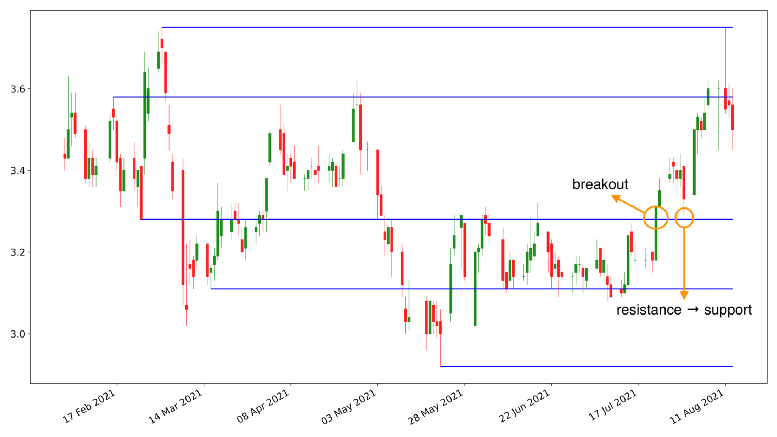
Estimation of stock prices when they hit the breakout point
Estimation of Support and Resistance Levels
For this, first, we need to install the required libraries; for this, we need to create a life data.txt, then we need to add the necessary modules to our data.txt, and then we need to run the following command:
pip install –r data.txt
#Importing the libraries
importnumpy as np
import pandas as pd
importmatplotlib.pyplot as plt
importpandas_datareader as web
from math import sqrt
fromscipy.signal import  savgol_filter
fromsklearn.linear_model import LinearRegression
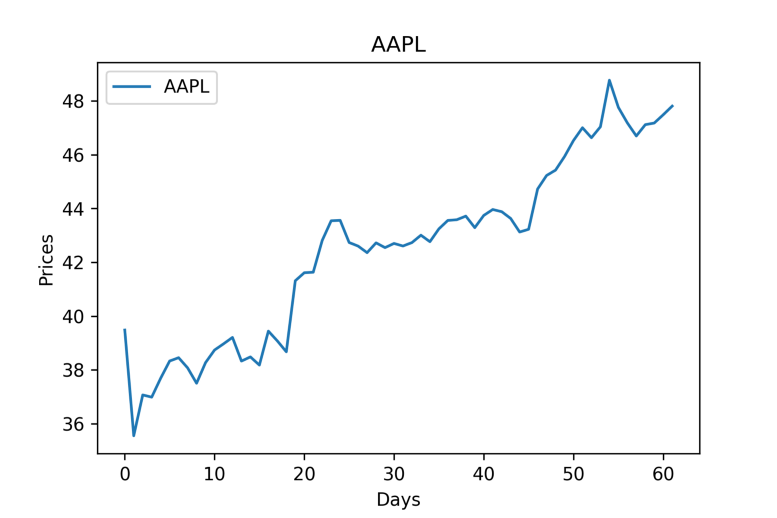
Now we need to get the closing values of the stock prices from January 1, 2022, to April 1, 2022; we can also apply this algorithm to other stock prices at different times. With the help of the pandas_datareader, we can get the stocks' closing prices. Now we need to add the stock prices in a numpy array, and finally, we need to plot the data.
Code:
#Importing the libraries
importnumpy as np
import pandas as pd
importmatplotlib.pyplot as plt
importpandas_datareader as web
from math import sqrt
fromscipy.signal import  savgol_filter
fromsklearn.linear_model import LinearRegression


sym = ‘PPLA’
df = web.DataReader( sym,  ‘gmail’ , ‘01-01-2022’,  ‘01-04-2022’)
s = df[‘Close’]
s.index = np.arrange(s.shape[0])
Creation of the support lines and the Resistance lines:
Now we need to create the support and resistance lines; here, we will provide the local minimum and the local maximum values of the given stock values. As the equation of the line is y=mx+c where the y is the y-axis coordinate, and the m is the slope of the line, we will consider the slope of the line as the slope of the local max for the resistance line and the local min values for the support line values. Finally, we will plot the graph with the support and resistance lines.
Code:
support_line = (local_min_slope* np.array(s.index)) + local_min_int
resistance_line = (local_max_slope *np.array(s.index)) + local_max_int
plt.title(sym)
plt.xlabel(‘Days’)
plt.ylabel(‘Prices’)
plt.plot(s, label= sym)
plt.plot(support_line, label=’Support’ , c=’r’)
plt.plot(resistance_line, label=’Resistance’, c=’g’)
plt.legend( )
plt.show( )
Graph:
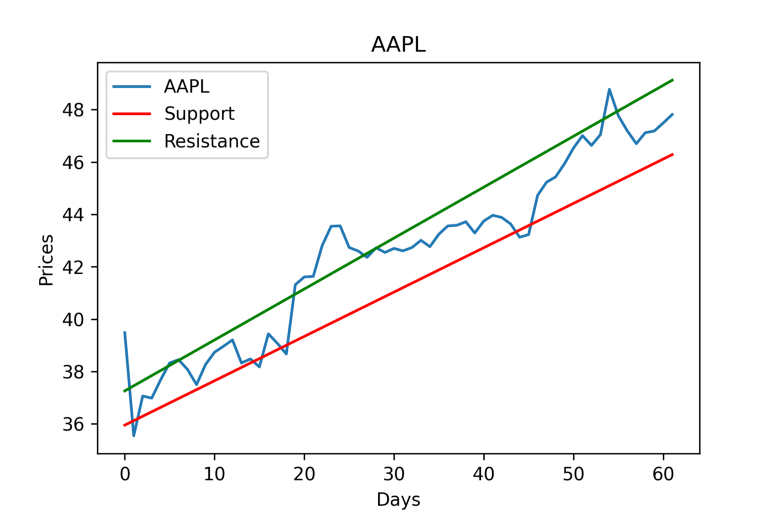
Here we can observe that we have plotted the original stock prices along with the resistance and support lines, which are further used for analyzing the stock prices. The support and the resistance lines play an important role in estimating the stock prices and estimating the stock market's growth.