Python Debugger
In this tutorial, we will understand what is debugging in general. Then we will realize what the python debugger means and what is the method to perform it.
Now, let us move toward our topic.
Debugging
It is the process which is used by the developers to find out the error or bug and then resolve it to enable the code to run smoothly. Simply, it is a way of keeping the code free of bugs.
Python Debugger
A communicating source code environment for Python programs is known as Python Debugger Python allows debugging the code using a default module named pdb module. (Python developer module)The module needs to be imported into a python script to use it. The pdb module employs the basic debugger functions i.e., bdb, and line-oriented command interpreters i.e., cmd.
The pdb is advantageous as it runs entirely in the command line so making it great for debugging code on isolated servers in case the user lacks the privilege of a debugger based on Graphic User Interface.
Following are the things supported by pdb:
- Setting of breakpoints
- Stepping through code
- Listing of source code
- Inspecting stack traces
It is required to import the module to be able to use the pdb module.
Syntax to import pdb:
import pdbInvoking a debugger
A debugger can be invoked by several methods.
- For debugging within the program-
It is required to insert the following two commands import pdb and pdb.set_trace().
Further, it is required to execute the script ordinarily and execution will continue until it reaches the introduced breakpoint.
Here is an example that shows how to insert the set_trace() function.
Example 1: Addition of two numbers
Planned error: Asthe input() function returns a string the program concatenates those strings as a replacement for adding input numbers
import pdb


def sum(a1, a2):
	answer = a1 + a2
	return answer


pdb.set_trace()
b1 = input("Enter the 1st number: ")
b2 = input("Enter the 2nd number : ")
result = sum(b1, b2)
print(result)
Output:
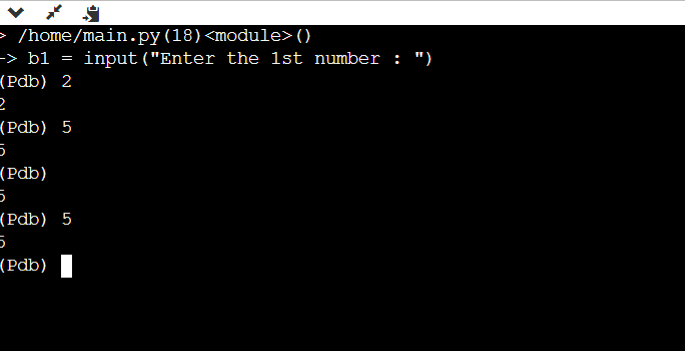
Explanation: This image shows the output of the code written above. Here, the number 18 denotes the line number where the breakpoint is found in the main.py module. The next line denotes the code line where the execution stops.
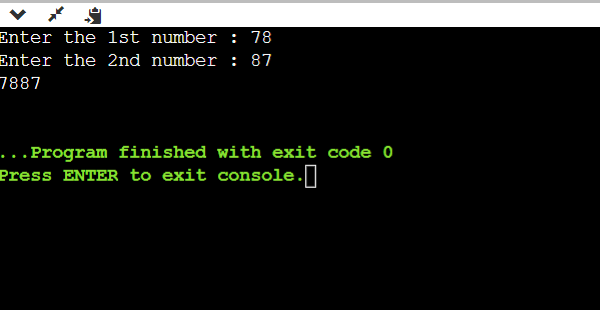
- From the Command Line:
This method is considered the simplest means of employing a debugger. It just requires running the following command in the terminal.
python -m pdb file nameThe above declaration loads the source code and stops implementation on the first line of code
#Python program to understand the debugger


def add(a1, a2):
	res = a1 + a2
	return res


b1 = input("Enter the 1st number : ")
b2 = input("Enter the 2nd number : ")
sum = add(b1, b2)
print(sum)
Output:
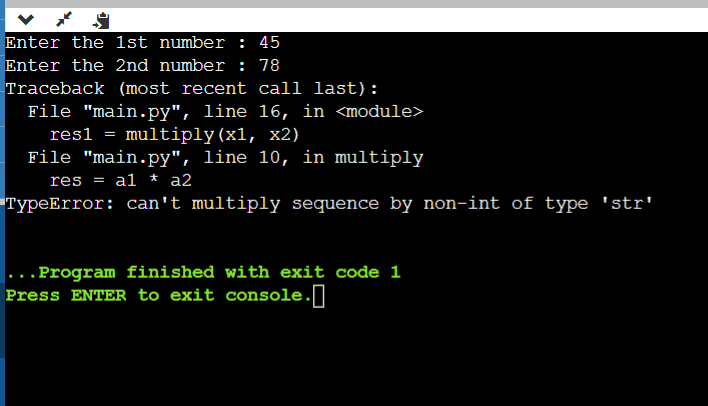
- Post-mortem debugging
It means getting into debug mode once after the execution process of the program is completed which means the failure has already occurred.
The pdb module supports post-mortem debugging through the function named post_mortem() or pm(). An active trace back is looked at by this function and the debugger is initiated at the line in the call stack where the exception occurred.
Example:
# Python program to understand post-mortem debugging


def multiply(a1, a2):
	res = a1 * a2
	return res


x1 = input("Enter the 1st number : ")
x2 = input("Enter the 2nd number : ")
res1 = multiply(x1, x2)
print(res2)
Output:
Checking variables on the Stack
Each variable including local variables as well as global variables is maintained on the stack. All the arguments of a function can be printed using args(or use a) function that is currently active. p command evaluates an expression given as an argument and prints the result.
Python pdb Breakpoint
While working with bulky programs we often need to increase the number of breakpoints at the point where we know errors might occur. To organize this user just need to usethe break command. When a breakpoint is inserted, the debugger allocates a number to it starting from 1.
Then the break command is employed to display all the breakpoints present in the program.
Managing Breakpoints
we can accomplish the breakpoints usingthe enable and disable and remove commands after the addition of breakpoints with the aid of numbers allocated to them.
It is the disable command which prevents the debugger from stopping when that breakpoint is reached while enable command turns on the disabled breakpoints.