
Explain sklearn clustering in Python
Make a connection and patterns across datasets by using clustering, one of the unsupervised machine learning approaches. Grouping is crucial because it ensures unlabelled data's natural clustering. The sample from the dataset is then categorised in accordance with features that share a large number of similarities.
It is described as a method for grouping data points into several classes based on their similarities. The potentially similar objects are kept in a cluster that hardly resembles any other.
An unsupervised machine learning technique called k-means clustering is used to find groups of data objects in a dataset. Although there are many alternative clustering techniques, k-means is one of the most established and user-friendly. A range of methods known as clustering are used to divide data into groups or clusters.
There are numerous additional uses for clustering, including social network analysis and document clustering.
This is accomplished by identifying related patterns in an unlabeled dataset, such as the activity, size, color, and shape, and then categorizing the data according to the presence or absence of such trends. The method uses an unlabelled dataset and receives no supervision because it uses independent supervised learning. The Python Scikit-learn module's sklearn.cluster function may be used to cluster unlabeled data.
K-Means Clustering Using Scikit-Learn
This technique calculates the centroids of the clusters of various data classes and iteratively pinpoints the optimal centroid. The main goal of this clustering approach is to reduce the inertia restriction when clustering the input data by dividing samples into n groups with similar variances. Given that it requires the number of clusters as a parameter, it presupposes already recognized clusters exist for the dataset in question.
The number of clusters is indicated by the value of k. Sklearn.cluster is a feature of Python Scikit-Learn. This task is carried out using KMeans clustering. The cluster centers and inertia value may be calculated using sklearn.cluster using the sample weight option. Some samples will receive more weight thanks to the KMeans module.
K-Means Clustering Algorithm
The dataset of N number of samples is divided into K groups of disjoint groups using the k-means clustering approach, and each group's mean is used to describe its samples. The means are sometimes referred to as the cluster's "centroids," although they occupy the same region. Typically, the points from the independent feature X are not centroids.
The objective of the Kmeans clustering technique is to reduce the sum of squares criterion, or inertia, inside the cluster.
Depending on how closely connected the attributes of the samples are, the four key phases of the k-means clustering algorithm can be used to group the samples into various groups.
To act as the initial cluster centers, choose k centroids randomly from the sample locations.
Set the nearest centroid to each sample point.
Place the centroids at the center of the clusters' sample points.
Repeat steps 2 and 3 as necessary to reach the user-defined tolerance level for the most iterations possible or until no modifications to the cluster classes are visible.
class sklearn.cluster.KMeans(n_clusters = 8, *, init = 'k-means++', n_init = 10, max_iter = 300, tol = 0.0001, verbose = 0, random_state = None, copy_x = True, algorithm = 'lloyd’)
Parameters:
n_clusters: This figure denotes the number of clusters and centroids that must be built.
Init: The procedure for initialization
K-means++ carefully selects the initial cluster centers for k-mean clustering to speed up convergence.
The dataset's "random" function chooses the number of cluster observations (rows) for the initial centroids.
n_init: how many different centroid seeds will be used in the k-means clustering algorithm's iterations? The final scores will be the best outcome of the n_init subsequent cycles with inertia reduced.
max_iter: This determines the most iterations of the k-means clustering technique that may be performed in one run.
tol: The distance between the cluster centers of two subsequent iterations with proportionate tolerances concerning the Frobenius norm is called convergence.
Verbose: Verbosity level.
random_state: The centroid initialization random sample's generation is controlled by this option. By utilising an int, you can make the randomization deterministic.
copy_x: It is more technically accurate to center the data first when calculating distances in advance. If copy_x is set to True, the starting data is not altered (the default value). If False, the starting date is modified and restored before the procedure ends.
Algorithm: specifies the K-means clustering technique to be used.
Program
# Python application that demonstrates KMeans clustering in action
# The necessary libraries are imported
import matplotlib.pyplot as plt
from sklearn.datasets import make_blobs
from sklearn.cluster import KMeans
# independently and dependently generated features for the cluster dataset
U, V = make_blobs(
        n_samples = 20, n_features = 9,
        centers = 9, cluster_std = 14,
        shuffle = True, random_state = 142
        )
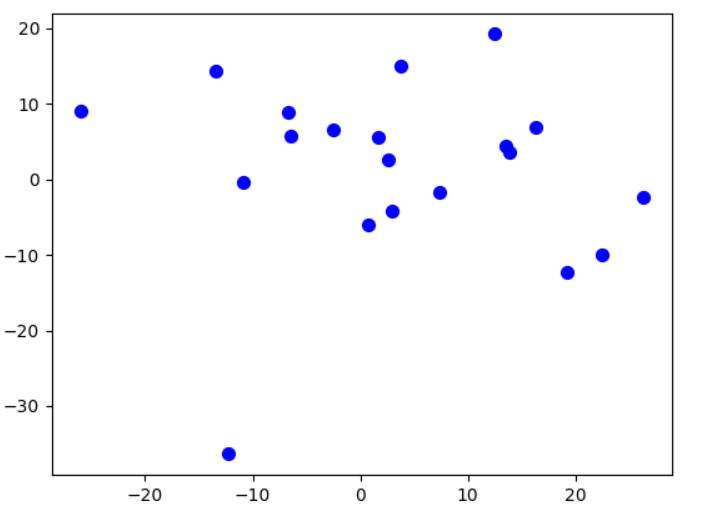
# drawing the initial clusters on a graph
plt.scatter(
        U[:, 0], U[:,1],
        c = 'blue',
        marker = 'o', s = 50
    )
plt.show()
K_Means = KMeans(
        n_clusters = 3, init = "k-means++",
        n_init = 15, max_iter = 350,
        tol = 1e-04, random_state = 10
    )
y_kmeans = K_Means.fit_predict(X)
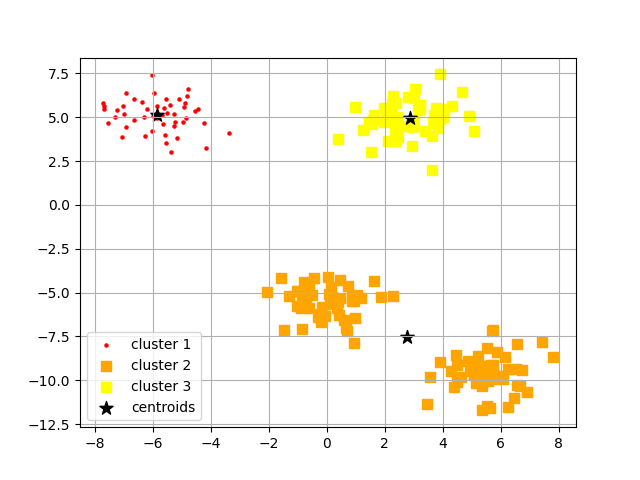
# Plotting the three groups that kmeans produced
plt.scatter(
        X[y_kmeans == 0, 0], X[y_kmeans == 0, 1],
        s = 5, c = 'red',
        marker = 'o', label = 'cluster 1'
    )
plt.scatter(
        X[y_kmeans == 1, 0], X[y_kmeans == 1, 1],
        s = 42, c = 'orange',
        marker = 's', label = 'cluster 2'
    )
plt.scatter(
        X[y_kmeans == 2, 0], X[y_kmeans == 2, 1],
        s = 42, c = 'yellow',
        marker = 's', label = 'cluster 3'
    )
# displaying the 3 clusters and 3 centroids in a graph
plt.scatter(
        K_Means.cluster_centers_[:, 0], K_Means.cluster_centers_[:, 1],
        s = 100, marker = '*',
        c = 'black',
        label = 'centroids'
    )
plt.legend(scatterpoints=1)
plt.grid()
plt.show()
Output:
The Elbow Method
Even though k-means performed really well our test dataset, it's important to keep in mind one of its limitations is that we must first define k, the number of clusters, before we can determine what the ideal k is. The number of clusters to choose may only sometimes be obvious in real-world scenarios, especially if we work with a dataset with many hidden aspects.
The elbow method is a useful graphical tool for calculating the optimum number of clusters, k, for a certain activity. As k grows, the within-cluster SSE (or distortion) decreases. This will bring the data closer to their respective centroids.
Hierarchical Clustering
Using a top-down or bottom-up method, hierarchical clustering divides data into groups. Either it starts with a single cluster composed of all the samples within the dataset. It splits that cluster into other clusters, or it starts with multiple clusters composed of all the samples in the dataset and combines them based on specific metrics to create clusters with further measurements.
The outcomes of hierarchical clustering can be shown as a dendrogram as it proceeds. We may decide how deeply to cluster by tying "depth" to a threshold (when to stop).
There are two kinds:
Agglomerative Clustering: Beginning with a unique dataset sample and its clusters, we iteratively merge these randomly generated clusters into more noticeable clusters depending on a criterion until only one cluster remains after the procedure.
Divisive Clustering: The original dataset is first collected into a single cluster in this method. After that, every cluster is split up into smaller clusters, and so on, until each cluster contains just one sample.
Single Linkage: In order to employ the linkage strategy, we unite the two clusters with the most equivalent two members using pairs of elements from each cluster that are the most similar to one another.
Complete Linkage: Using this linking approach, we choose the data from each cluster that is the most distinctive and merge them into the two clusters with the closest dissimilarity.
Average Linkage: The most comparable samples from each cluster are coupled using average distance in this linking strategy. The cluster with the most similar members is combined to produce a newgroup.
Ward: By using this method, the total squared distances determined for all cluster combinations are reduced in value. The concept is the same as KMeans, despite the hierarchical manner.
You should be aware that we compare similarities based on distance, typically euclidean distance.
class sklearn.cluster.AgglomerativeClustering(n_clusters = 2, *, affinity = 'euclidean', memory = None, connectivity = None, compute_full_tree = 'auto', linkage = 'ward', distance_threshold = None, compute_distances = False)
Parameters
n_clusters: The number of clusters formed by the method. It needs to be None if the distance threshold parameter is None.
Affinity: The metric used in the linkage computation is indicated by this parameter. You can pick from L1, L2, Euclidean, Cosine, Manhattan, or Precomputed. If the connection technique is "ward," only "euclidean" is eligible. Whenever "precomputed," a proximity matrix, instead of Fit, requires a similarity matrix as input. Approach.
Memory: The output of the tree analysis is kept there. Caching is not performed by default. The path to the cache directory is stated when a string is supplied.
Connectivity: The connection matrix is used by this parameter.
compute_full_tree: The algorithm terminates the tree building at n clusters.
Linkage: The connecting criterion specifies which metric should be used to calculate the distance between the sets of observations. The method will aggregate cluster configurations that minimize this factor into a single cluster.
distance_threshold: The maximum connection gap among cluster pairings beyond which clusters cannot be combined. The values of computing full tree and n clusters must be True if they are not given or are None.
compute_distances: Even when the distance threshold value is not applied, this parameter still calculates the distances between the cluster pairs. This enables analysis of the dendrogram. However, there is a memory and computational penalty.
BIRCH
Balanced Iterative Reducing and Clustering with Hierarchies is referred to as BIRCH. This program is used to do hierarchical clustering on huge data sets. The supplied data generates a CFT, or Characteristics Feature Tree.
With CFT, keeping all input data in memory is unnecessary because the data nodes, often referred to as CF (Characteristics Feature) nodes, hold the necessary information during clustering.
The same is implemented in the Scikit-learn cluster using the sklearn.cluster.
A Birch module is used to execute BIRCH clustering.