Java Plot
Java Plot is a phrase in Java that is mostly used for plotting coordinates on a cartesian plane. Plotting graphs in Java is accomplished through the use of various core Java concepts. We plot with swing, awt, and awt.geom.
- In program, we use the Swing package to implement Jlabel, JButtons, and JPanel.
- To create a graphical user interface for the project's front-end, we use AWT (Abstract Window Toolkit).
- To conduct two-dimensional geometry operations, the awt.geom package is utilised.
To plot a point on a graph, we employ numerous graphics techniques such as draw (), setPaint (), and Fill (), among others. Let's have a look at a graph to see how we can plot coordinates in Java.
PlotJex.java:
import java.awt.*;
import javax.swing.*;
import java.awt.geom.*;

public class PlotJex extends JPanel{

    int[] crd = {75, 30, 50, 90};
    int mrg = 78;

    protected void paintComponent(Graphics grcs){

        super.paintComponent(grcs);
        Graphics2D gph = (Graphics2D)grcs;

        //Sets the value of a single preference for the rendering algorithms.
        gph.setRenderingHint(RenderingHints.KEY_ANTIALIASING, RenderingHints.VALUE_ANTIALIAS_ON);

        // wdt-width and hgt-height
        int wdt = getWidth();
        int hgt = getHeight();
        gph.draw(new Line2D.Double(mrg, mrg, mrg, hgt-mrg));
        gph.draw(new Line2D.Double(mrg, hgt-mrg, wdt-mrg, hgt-mrg));
        double x = (double)(wdt-2*mrg)/(crd.length-1);
        double scale = (double)(hgt-2*mrg)/getMax();
        // color the points
        gph.setPaint(Color.GREEN);
        // points on the graph
        for(int i=0; i<crd.length; i++){
            double xp1 = mrg+i*x;
            double yp1 = hgt-mrg-scale*crd[i];
            gph.fill(new Ellipse2D.Double(xp1-2, yp1-2, 4, 4));
        }
    }
    // getMax() to find max value
    private int getMax(){
        int mx = -Integer.MAX_VALUE;
        for(int i=0; i<crd.length; i++){
            if(crd[i]>mx)
                mx = crd[i];
        }
        return mx;
    }
    public static void main(String args[]){
        // instance for JFrame
        JFrame frm = new JFrame();
        // size,location and layout
        frm.setDefaultCloseOperation(JFrame.EXIT_ON_CLOSE);
        frm.add(new PlotJex());
        frm.setSize(350, 340);
        frm.setLocation(250, 210);
        frm.setVisible(true);
    }
}
Output :
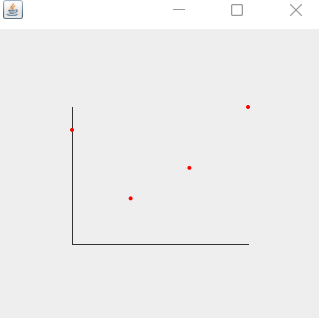
PlotExample is the class created in the preceding code for plotting the graph, and chord is an array of values that are treated as coordinates to be plotted on the graph. In addition, we enhance the JPanel class to represent the graph.
Note: The Panel's layout is Flow-Layout by default, but we may change it to any other layout we like, such as grid layout, card layout, box layout, and border layout, among others.
To draw the graph on JPanel, we use super.paintComponent(g). We use the Super keyword in our code to invoke the parent class method or function Object () { [native code] }. In our scenario, the Super function invokes the JPanel class's paintComponent (g) method.
For control over geometry, we use the Graphic 2D class (a fundamental class for two-dimensional shapes that extends the Graphics class).
We employ RenderingHints, which are basic suggestions for Java 2D on how it should render. Simply put, rendering refers to how something is done.
The setRenderingHints () function is used to set new hints and change old ones.
Antialiasing is used to smooth jagged edges when the resolution is poor.
We need four coordinates to create lines representing the x and y axes: x1, y1, x2, and y2. In our code, we utilise the g1.draw () function to create lines.
To change the colour of the points on the graph, we utilise the setpaint () function.
We utilise the for loop in our code, and coordinates are used within that loop.
length () returns the coordinates array's length.
We utilise the getWidth () and getHeight () methods of the component to get the component's height and width.
Instead of the cartesian plane, we plot the points with regard to the size of the component using the xp1 and yp1 variables.