What is a Legend?
A legend is a key or guide used to help explain the meaning of symbols, colours, or other elements in a graphical representation, such as a map, chart, or graph. The term "legend" is often used interchangeably with "key," "caption," or "explanatory notes" and serves to help make information more accessible and easier to understand.
Legends can be found in various applications, from physical maps and charts to computer software and data visualization tools. They are often used to convey complex information or data visually and intuitively, making it easier for users to interpret and understand.
One of the easiest examples of a legend is a map legend. This type of legend is typically found on physical maps and provides information about the meaning of symbols, such as roads, bodies of water, and geographic features. For example, a map legend might include a symbol for a mountain range, along with a note explaining that the symbol represents a mountain range and indicating the elevation of the range in meters or feet.
In addition to physical maps, legends are also commonly used in digital mapping applications, such as Google Maps or Apple Maps. In these applications, the legend may be interactive, allowing users to toggle between different views or layers to see different types of information, such as traffic conditions, public transportation routes, or satellite imagery.
Another example of a legend can be found in charts and graphs. These legends typically provide information about the meaning of different colours, patterns, or shapes used to represent data. For example, in a line graph showing a city's population growth over time, the legend might include a line colour for each decade and a note explaining what each line represents.
Legends in Scientific Data Visualization
Legends are also commonly used in scientific data visualization. For example, in a molecular model, a legend might indicate the meaning of different colours used to represent different types of atoms or different shapes used to represent different molecular structures.
In addition to helping users understand the meaning of symbols and colours, legends can provide context or additional information about a particular visualization. For example, in a bar chart comparing the sales of different products, the legend might include a note about the period represented or the geographic region covered by the data.
In some cases, legends can be interactive, allowing users to click on different legend elements to filter or highlight specific data points or categories. For example, in a scatter plot showing the relationship between two variables, the legend might include buttons to toggle between different data sets or to highlight specific data points based on their category.
Legends are essential for making complex information more accessible and easier to understand. Whether in maps, charts, graphs, or other forms of data visualization, legends provide users with the context and guidance they need to interpret and use data effectively.
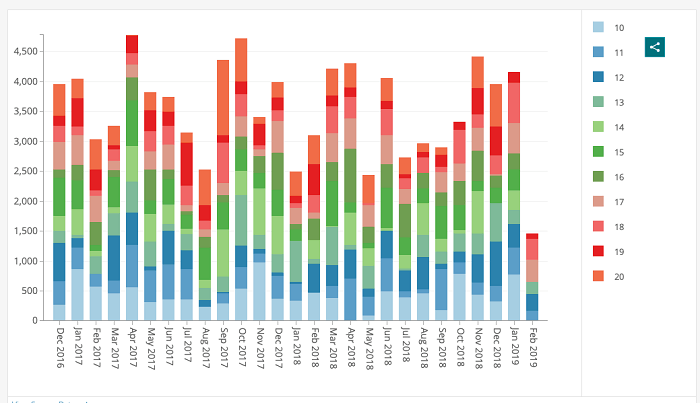
This is an example of a Legend used in a Graph.
Other Aspects of Legend
Legends are essential for maintaining consistency and accuracy in data visualization.
In addition to providing context and clarity for the reader, legends play an important role in maintaining consistency and accuracy in data visualization. In many cases, a legend is a reference for the complete visualization, ensuring that the symbols or colours used are consistent throughout.
For example, imagine a chart that shows the performance of different products over time, with each product represented by a different colour. With a legend, it may be easier for the reader to understand which colour represents which product or to compare the performance of different products accurately. Consistent use of colours or symbols can also lead to clarity and interpretation of the data.
By including a legend, data visualization designers can ensure that their visualizations are consistent and accurate and that the meaning of each element is communicated to the reader. In some cases, legends may also include information about the data source, the date range, or other important contextual information.
Legends can also convey additional information that may take time to be apparent in a visualization. For example, on a map, a legend may include information about the scale, orientation, or coordinate system used, which can be important for accurately interpreting the map. In a chart or graph, a legend may provide information about the units of measurement or the specific data points being represented.
Furthermore, legends can also be used to provide key information about the context or background of a visualization. For example, a legend on a graph or chart may include information about the data source, the methodology used to collect the data or the timeframe over which the data was collected. This information can be crucial for the reader to understand the significance and limitations of the data presented in the visualization.
Legends can also highlight specific elements within a visualization, such as outliers or points of interest. For example, in a scatter plot, a legend may highlight the data point representing the highest or lowest value or a point representing a significant event or change.
Finally, it's important to note that legends should be designed to be clear and concise, using appropriate terminology and symbols that the reader easily understands. They should also be placed in a prominent location within the visualization, such as in a corner or along the side of a chart or graph, to ensure they are easily visible and accessible.
In summary, legends are essential for effectively communicating complex information in data visualization. They provide context and clarity, help maintain consistency and accuracy, and ensure the reader can interpret the data correctly. As data visualization grows in importance across various industries, using clear and effective legends will become increasingly important for successfully communicating complex information.
Legend Tag in HTML
The <legend> tag in HTML defines a caption or title for an <fieldset> element. A <fieldset> is a grouping element used to group related form elements, such as text fields, radio buttons, checkboxes, etc. The <legend> tag provides a title or caption for the <fieldset> element, which helps to make the form more accessible and easier to understand for users.
To use the <legend> tag, first define an <fieldset> element in your HTML code. The <fieldset> element is used to group co-related form elements together and often to group form elements into sections or categories. Once you have defined your <fieldset> element, you can use the <legend> tag to provide a title or caption for the group of form elements.
Here is an illustration of how to use the <legend> tag in HTML:
<form>
  <fieldset>
    <legend>Personal Information</legend>
    <label for="name">Name:</label>
    <input type="text" id="name" name="name"><br>
    <label for="email">Email:</label>
    <input type="email" id="email" name="email"><br>
    <label for="phone">Phone:</label>
    <input type="tel" id="phone" name="phone"><br>
  </fieldset>
</form>
In this example, the <fieldset> element groups together three form elements: a text input for the user's name, an email input for the user's email address, and a telephone input for the user's phone number. The <legend> tag provides a title or caption for the <fieldset> element, which in this case is "Personal Information".
The <legend> tag is an important element for improving the accessibility of forms on the web. It helps to provide a clear and concise title or caption for the group of form elements, which can be especially helpful for users with visual impairments or those using assistive technologies like screen readers.
In addition to providing a title or caption for the <fieldset> element, the <legend> tag can be styled using CSS to customize its appearance. This allows web developers to create more visually appealing forms consistent with the look and feel of their website or application.
In conclusion, the <legend> tag is an important HTML element for creating accessible and well-structured forms on the web. By providing a clear and concise title or caption for a group of related form elements, the <legend> tag helps to make forms easier to understand and use for all users.
Conclusion
In conclusion, legends are vital in communicating complex information to readers on a map, chart, or any other document. They provide essential context, help to maintain consistency and accuracy and ensure that the reader can interpret the data correctly. Clear and effective legends have become increasingly important as data visualization grows across various industries. As such, designers and communicators must consider the importance of legends in their work and use them appropriately to enhance the readability and effectiveness of their visualizations. By using legends in their work, designers can make their visualizations more accessible, understandable, and impactful, leading to more informed decision-making and better communication.